Fig. 25.
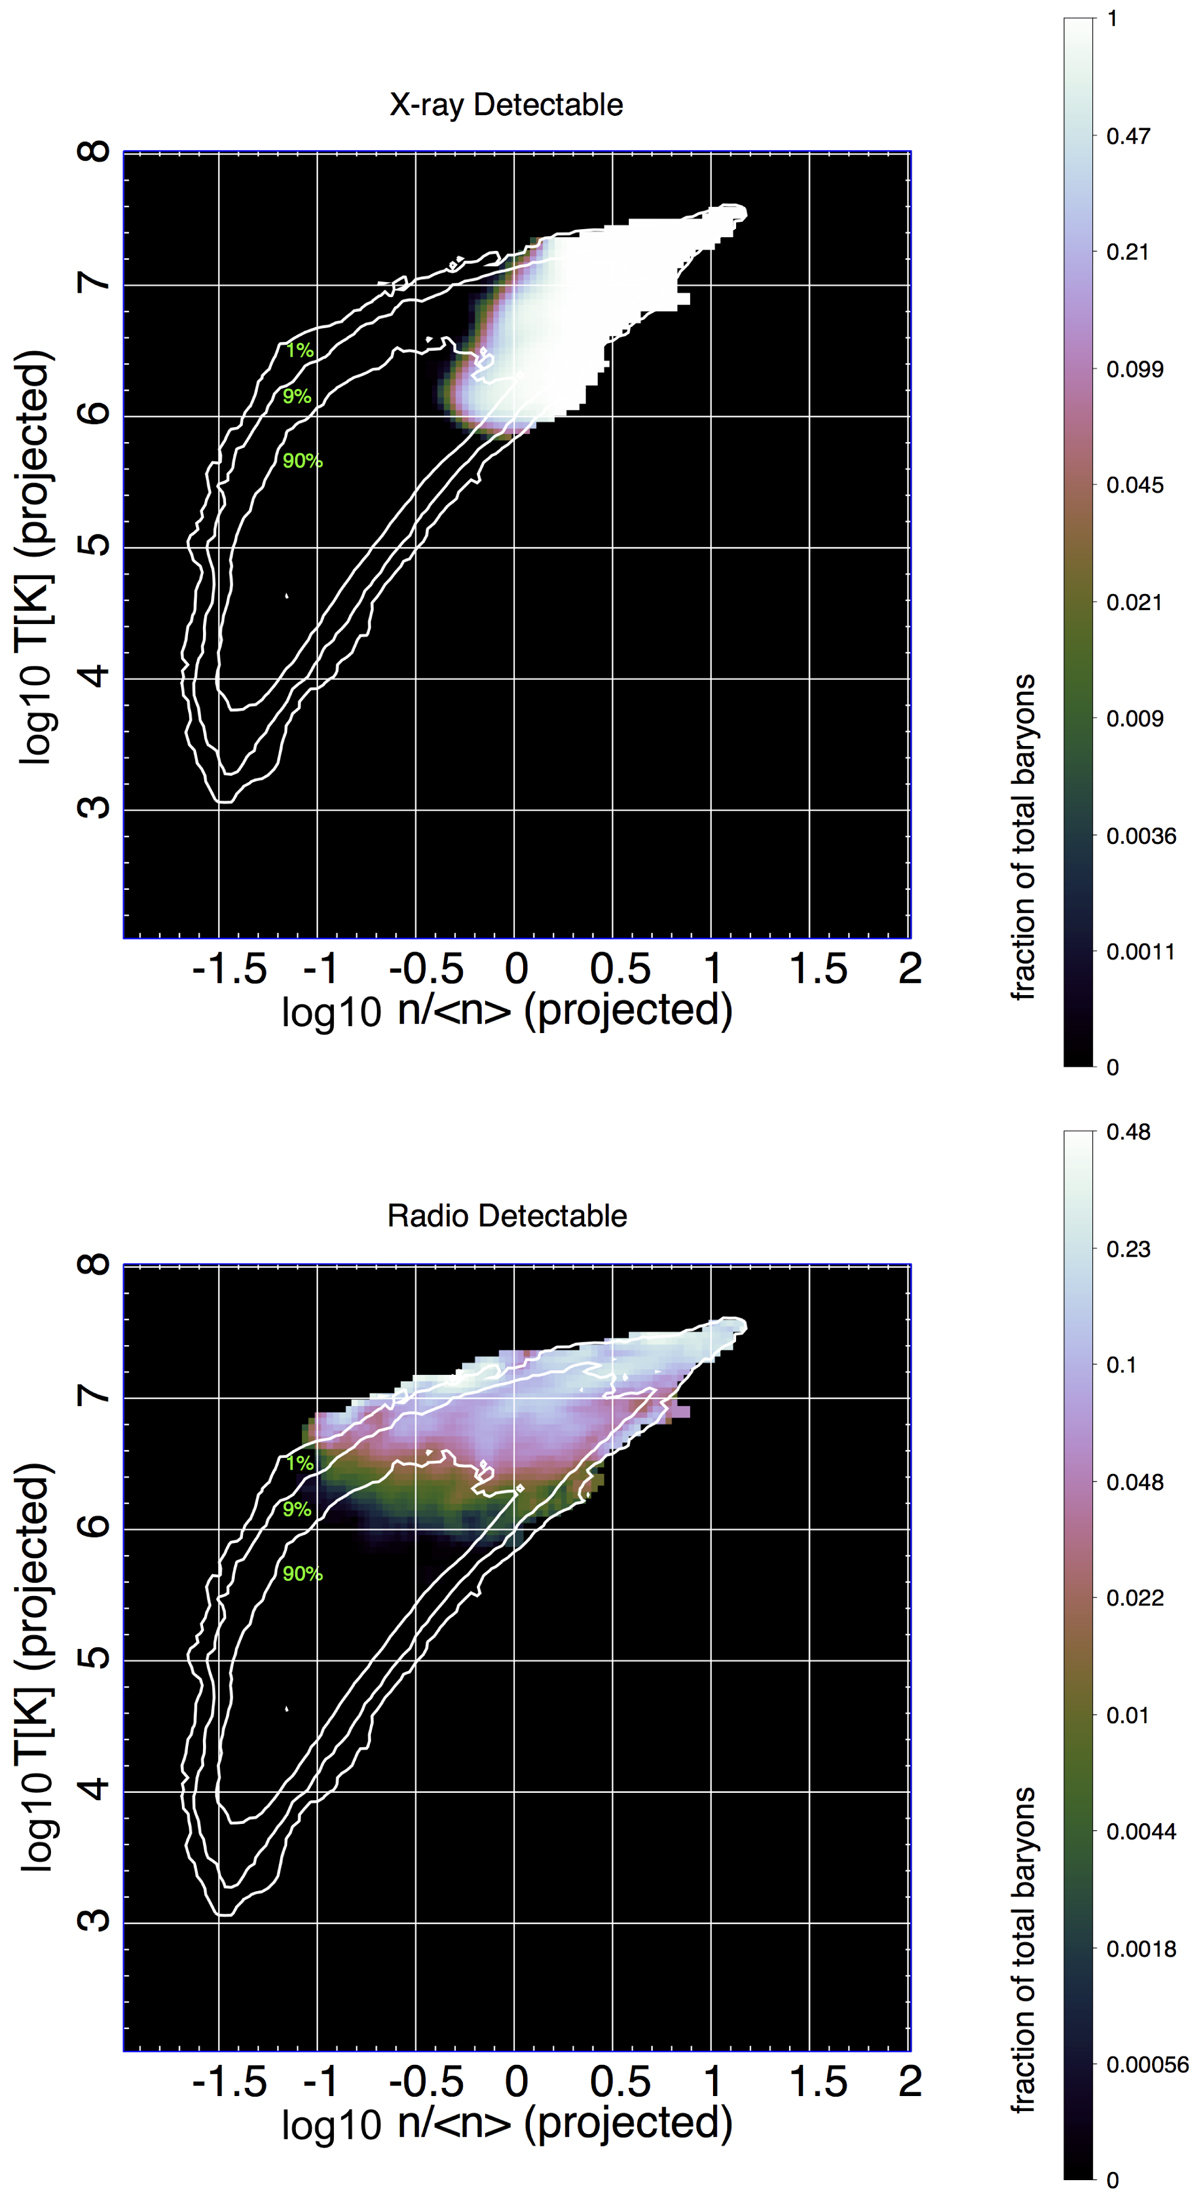
Distribution of projected mean temperature and density for all pixels in our sky model at z = 0.05. The total area within the isocontours marks the area where the 90%, 9%, and 1% of the baryon budget is contained. The colours mark the fraction of the total baryon budget that can be detected with X-ray detections with Athena (top panel) or with radio detections with SKA-LOW (bottom panel).
Current usage metrics show cumulative count of Article Views (full-text article views including HTML views, PDF and ePub downloads, according to the available data) and Abstracts Views on Vision4Press platform.
Data correspond to usage on the plateform after 2015. The current usage metrics is available 48-96 hours after online publication and is updated daily on week days.
Initial download of the metrics may take a while.