Fig. 24.
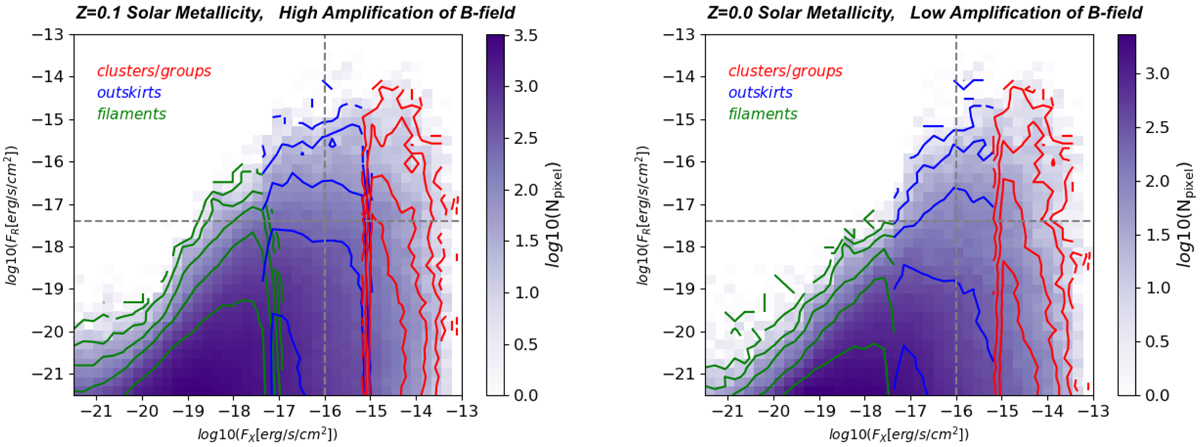
Distribution of X-ray and radio flux for variations of our sky model. Left panel: we considered a “high amplification model” for the magnetic field and we assumed a uniform gas metallicity of Z = 0.1 Z⊙ everywhere (instead of Z = 0.3 Z⊙ as in our baseline model); in the right panel we considered a low-amplification model and a zero metallicity everywhere. The meaning of colours and contours is as in Fig. 5. The text gives more details on the model variations.
Current usage metrics show cumulative count of Article Views (full-text article views including HTML views, PDF and ePub downloads, according to the available data) and Abstracts Views on Vision4Press platform.
Data correspond to usage on the plateform after 2015. The current usage metrics is available 48-96 hours after online publication and is updated daily on week days.
Initial download of the metrics may take a while.