Free Access
Fig. 22.
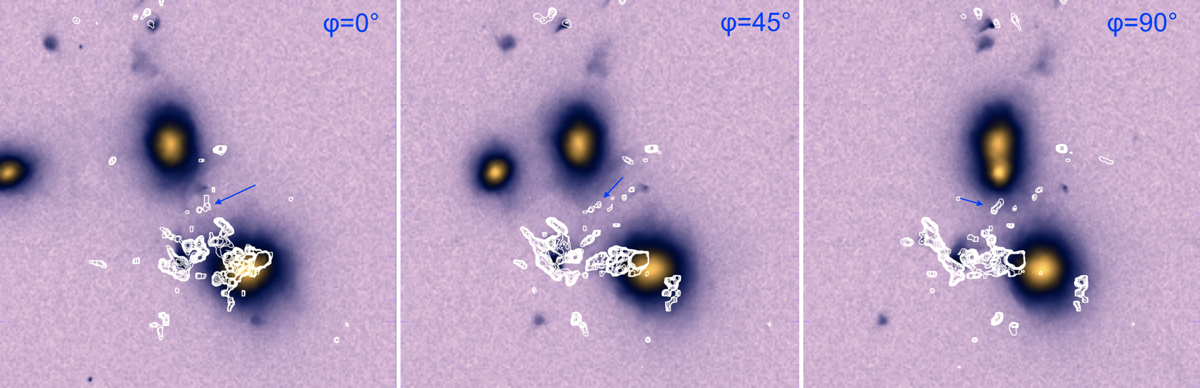
Three different rotations (0°, 45°, and 90°) around cluster E5A, showing the X-ray counts (colours) and the detectable radio emission at 260 MHz (contours). The additional blue arrow gives the approximate location of the detectable emission region in the rotated images.
Current usage metrics show cumulative count of Article Views (full-text article views including HTML views, PDF and ePub downloads, according to the available data) and Abstracts Views on Vision4Press platform.
Data correspond to usage on the plateform after 2015. The current usage metrics is available 48-96 hours after online publication and is updated daily on week days.
Initial download of the metrics may take a while.