Fig. 21.
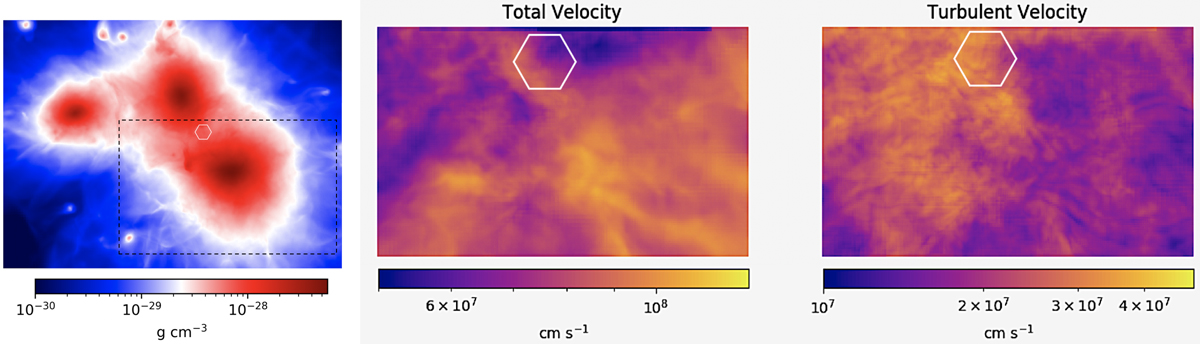
Left panel: projected mean gas density for the interacting cluster used for our SIXTE simulation in Sect. 3.3.4. Central and right panels: projected (volume weighted) map of total gas velocity module and of turbulent velocity module for a zoomed region in the left panel. The additional white region shows the 5′×5′ region used for our SIXTE mock observation.
Current usage metrics show cumulative count of Article Views (full-text article views including HTML views, PDF and ePub downloads, according to the available data) and Abstracts Views on Vision4Press platform.
Data correspond to usage on the plateform after 2015. The current usage metrics is available 48-96 hours after online publication and is updated daily on week days.
Initial download of the metrics may take a while.