Fig. 16.
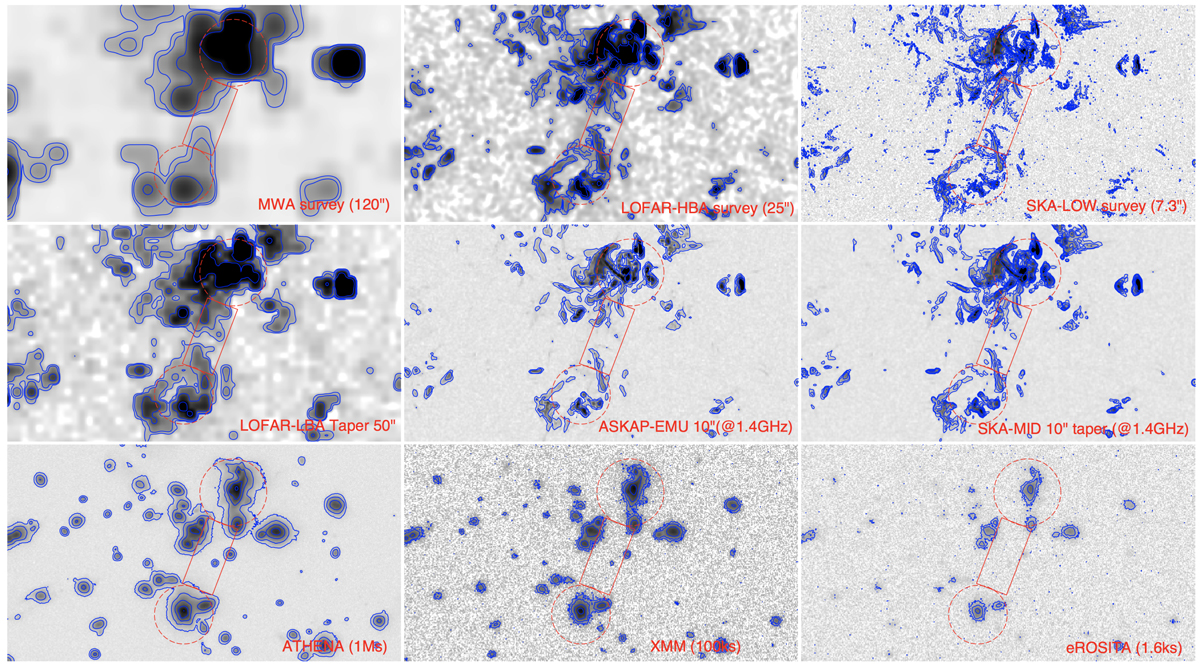
Example of mock radio (top two rows) and X-ray (bottom row) observations of two bridges connected to a ∼2 × 10¹⁴ M⊙ galaxy cluster in our simulation. The red circles denote the R100 of the halos connected by bridges with width 5′ (red rectangles), as in Sect. 3.3.3. In all panels, we give in colours the signal and noise of each mock observation, convolved for the resolution of each observation, while the blue contours are drawn with a logarithmic spacing, starting from 3 S/N of each observation (see text for explanations).
Current usage metrics show cumulative count of Article Views (full-text article views including HTML views, PDF and ePub downloads, according to the available data) and Abstracts Views on Vision4Press platform.
Data correspond to usage on the plateform after 2015. The current usage metrics is available 48-96 hours after online publication and is updated daily on week days.
Initial download of the metrics may take a while.