Fig. 13.
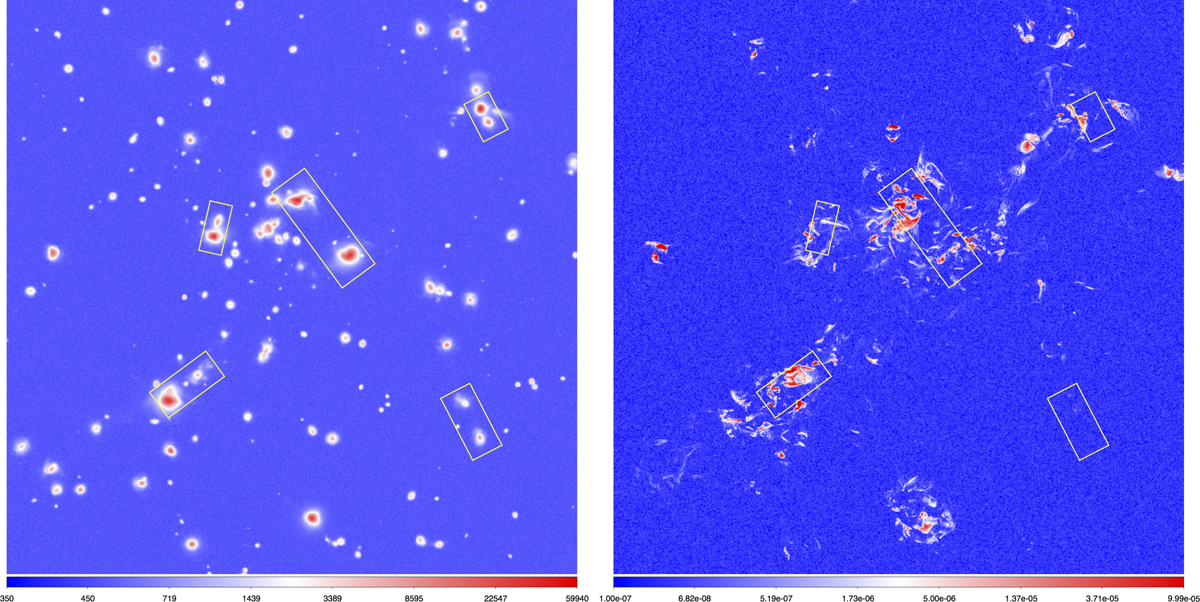
Close-up view of a crowded ∼30 × 30 Mpc2 region of Fig. 2. Each panel covers ∼8.5 ° ×8.5° in the sky. As in Fig. 12, the left panel gives the photon counts for a 1 Ms integration in the [0.8–1.2] keV band using WFI while the right panel gives the result of a mock radio survey at 260 MHz with the SKA-LOW, in both cases with noise included. The additional yellow rectangles show pairs of clusters with ongoing mergers.
Current usage metrics show cumulative count of Article Views (full-text article views including HTML views, PDF and ePub downloads, according to the available data) and Abstracts Views on Vision4Press platform.
Data correspond to usage on the plateform after 2015. The current usage metrics is available 48-96 hours after online publication and is updated daily on week days.
Initial download of the metrics may take a while.