Fig. 12.
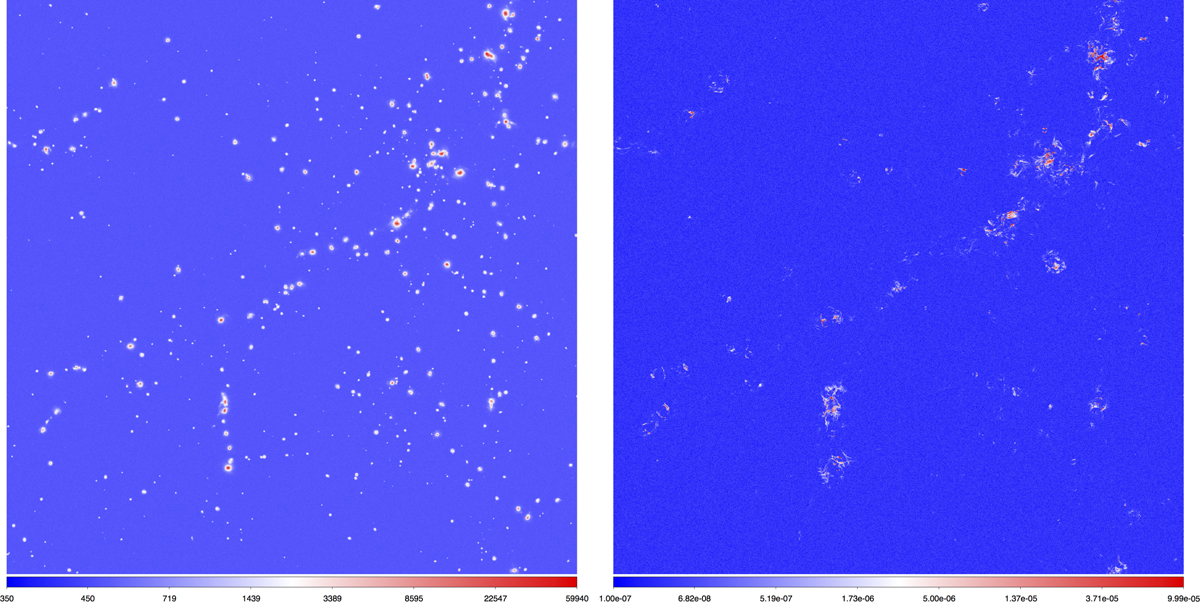
Mock X-ray (left) and radio (right) observations of the same simulated box of Fig. 1, located at z ≈ 0.05. The left panel shows the photon counts for a 1 Ms integration in the [0.8–1.2] keV band using WFI (see Sect. 2.2.1 for details) while the right panel gives the result of a mock radio survey at 260 MHz with the SKA-LOW (see Sect. 2.2.2 for details), in units of [Jy arcsec−2]. Each panel covers ∼28.4 ° ×28.4° in the sky. Both images include the noise level expected for the respective instrument, band, and integration time (in the case of SKA-LOW, we also consider the confusion noise level).
Current usage metrics show cumulative count of Article Views (full-text article views including HTML views, PDF and ePub downloads, according to the available data) and Abstracts Views on Vision4Press platform.
Data correspond to usage on the plateform after 2015. The current usage metrics is available 48-96 hours after online publication and is updated daily on week days.
Initial download of the metrics may take a while.