Fig. 11.
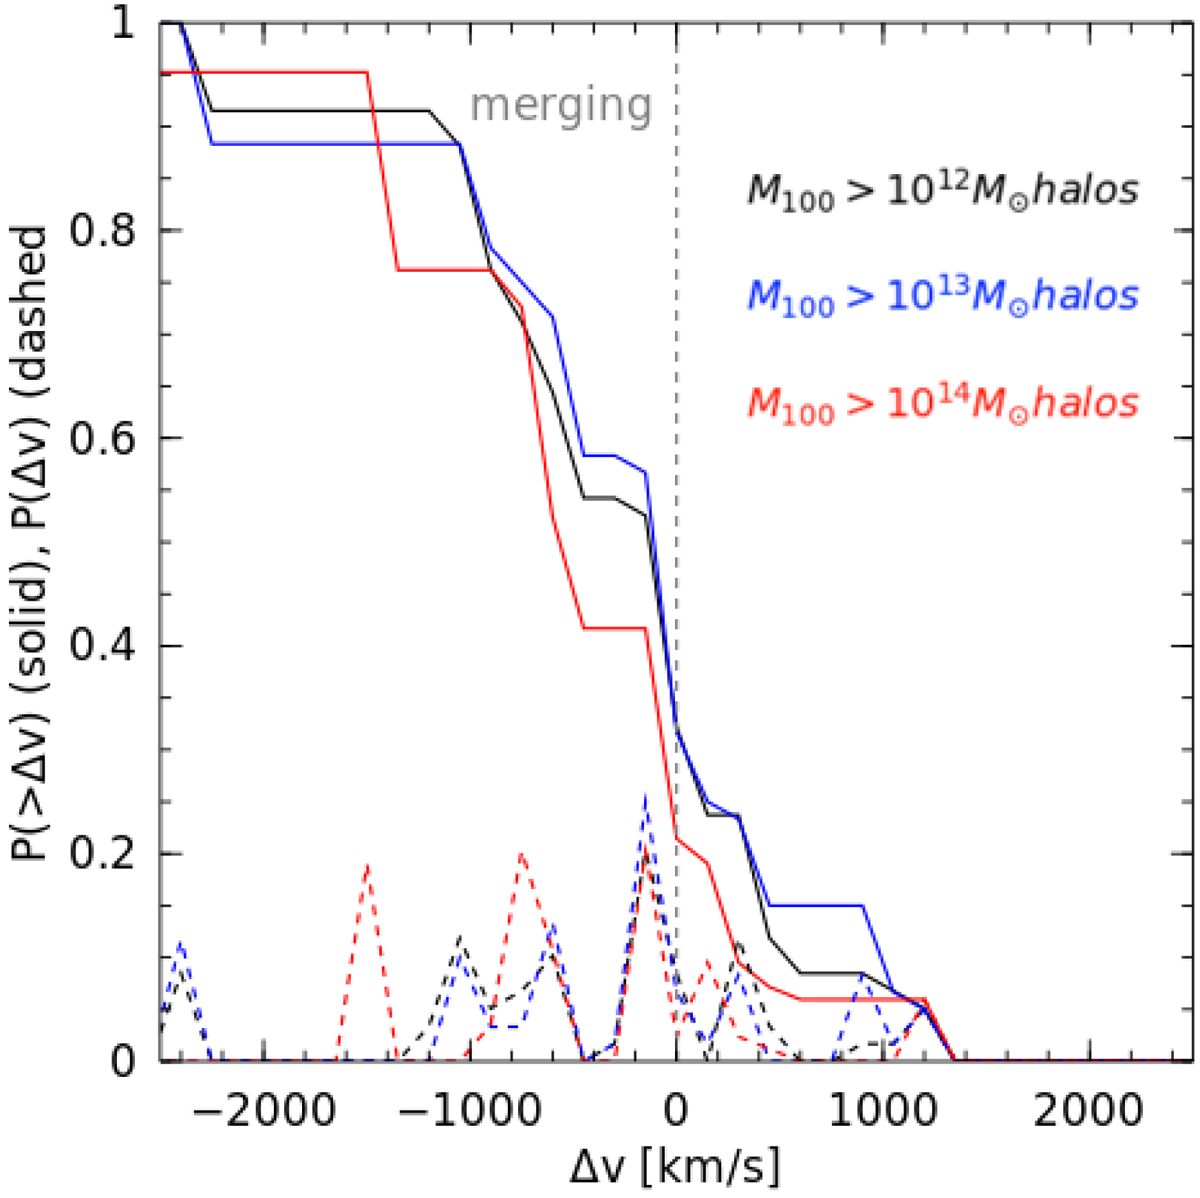
Cumulative (solid) and differential (dashed) distributions of the relative velocities between the two closest galaxy clusters around all doubly detectable pixels in our run at z = 0.05, limited to objects with a position angle |Δα|≤25° in Fig. 10. The different colours refer to different cuts in the cluster mass within our sample.
Current usage metrics show cumulative count of Article Views (full-text article views including HTML views, PDF and ePub downloads, according to the available data) and Abstracts Views on Vision4Press platform.
Data correspond to usage on the plateform after 2015. The current usage metrics is available 48-96 hours after online publication and is updated daily on week days.
Initial download of the metrics may take a while.