Free Access
Fig. 8
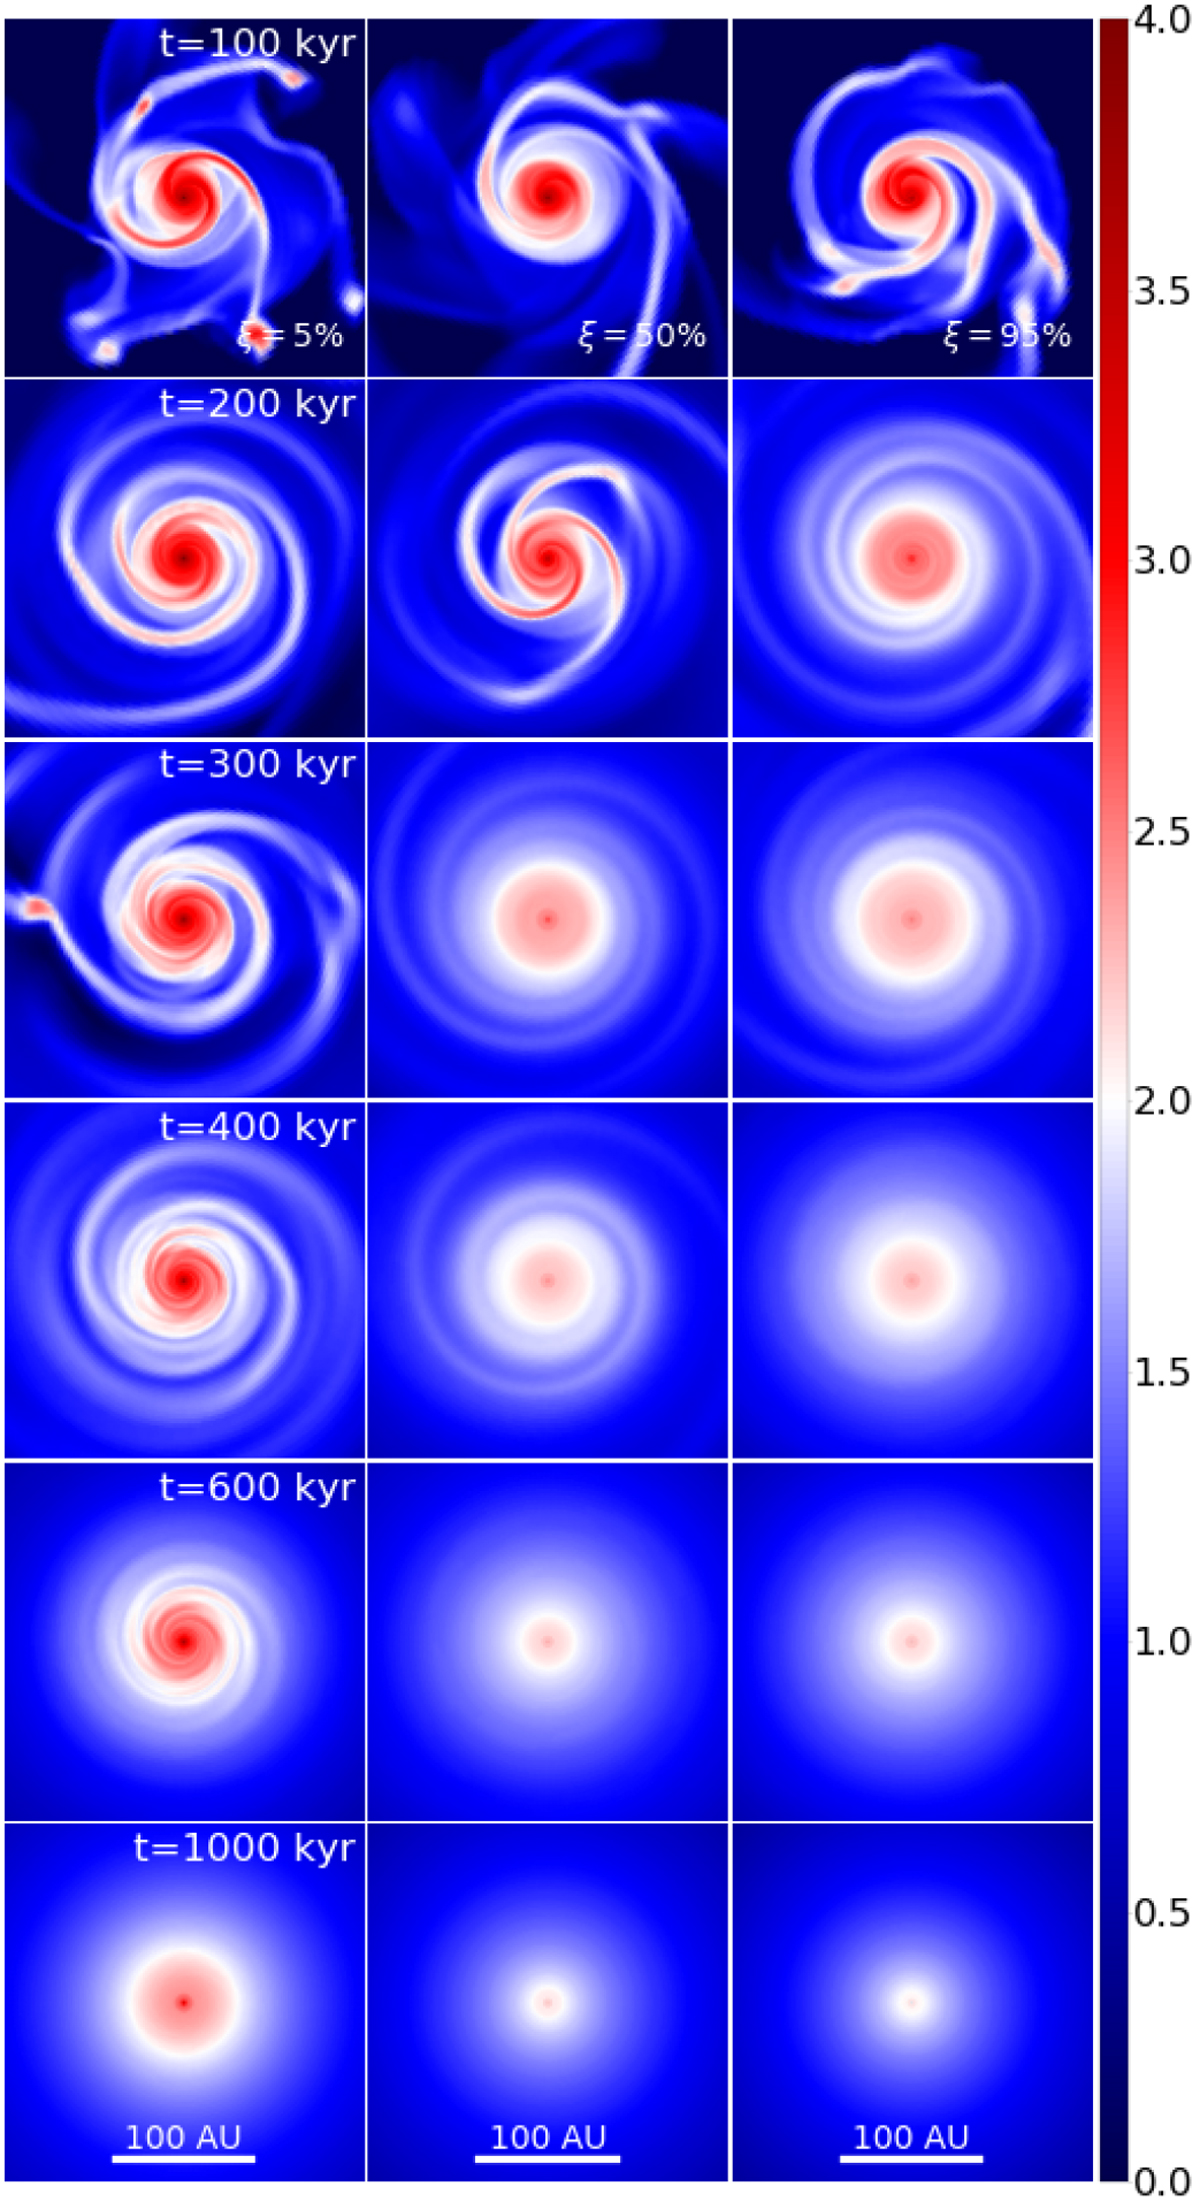
Gas surface density maps in the inner 250 × 250 au2 box shown at consecutive evolutionary times for all three models with distinct ξ-parameters. Time is indicated in the left column and is counted from the onset of numerical simulations and the disk forms at 56 kyr. The scale bar is in log g cm−2.
Current usage metrics show cumulative count of Article Views (full-text article views including HTML views, PDF and ePub downloads, according to the available data) and Abstracts Views on Vision4Press platform.
Data correspond to usage on the plateform after 2015. The current usage metrics is available 48-96 hours after online publication and is updated daily on week days.
Initial download of the metrics may take a while.