Fig. 7
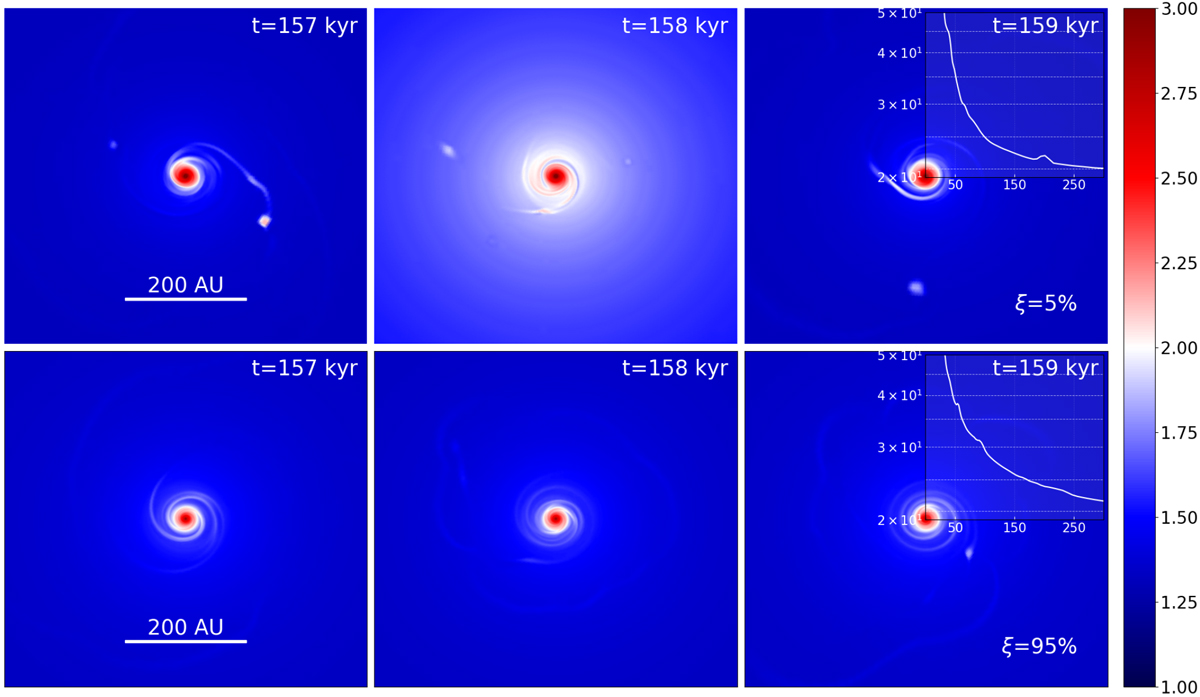
Top row: spatial maps of the gas temperature in the inner 600 × 600 au2 box before an accretion burst (left panel), during the burst (middle panel), and after the burst (right panel) for the ξ = 5% model. Bottom row: spatial maps of the gas temperature in the ξ = 95% model characterized by steady accretion without bursts. The same evolutionary times as for the ξ = 5% model are shown. The inset plots in the right column present the azimuthally averaged temperature on the same spatial scale as the 2D temperature maps. The scale bar is in log Kelvin.
Current usage metrics show cumulative count of Article Views (full-text article views including HTML views, PDF and ePub downloads, according to the available data) and Abstracts Views on Vision4Press platform.
Data correspond to usage on the plateform after 2015. The current usage metrics is available 48-96 hours after online publication and is updated daily on week days.
Initial download of the metrics may take a while.