Fig. 14
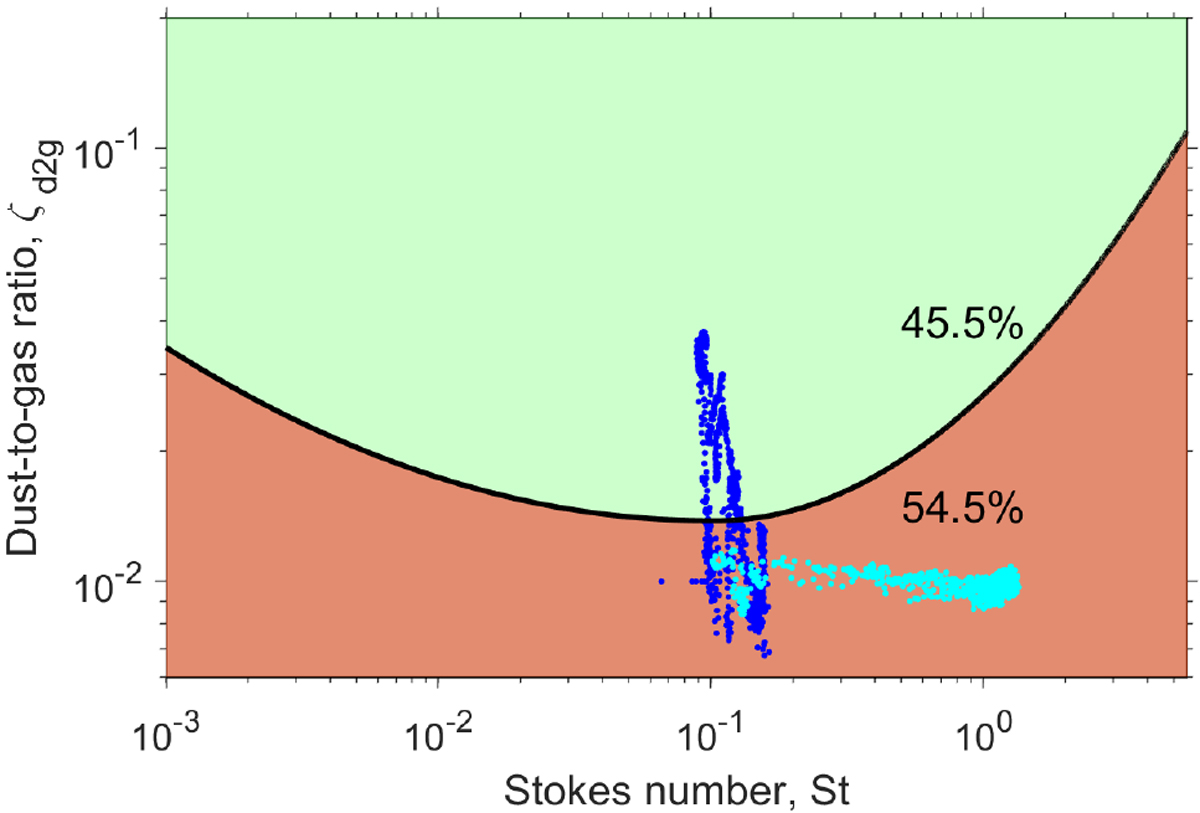
Regions in the ζd2g–St phase space that are subject to the development of a streaming instability (in green) and that are stable against a streaming instability (in brown). The corresponding data are taken from Yang et al. (2017). The blue dots present our data for the ξ = 5% model and the numbers show the percentage of time spent by this model in the unstable and stable regimes. The cyan dots present the corresponding data for the ξ = 95% model.
Current usage metrics show cumulative count of Article Views (full-text article views including HTML views, PDF and ePub downloads, according to the available data) and Abstracts Views on Vision4Press platform.
Data correspond to usage on the plateform after 2015. The current usage metrics is available 48-96 hours after online publication and is updated daily on week days.
Initial download of the metrics may take a while.