Fig. 13
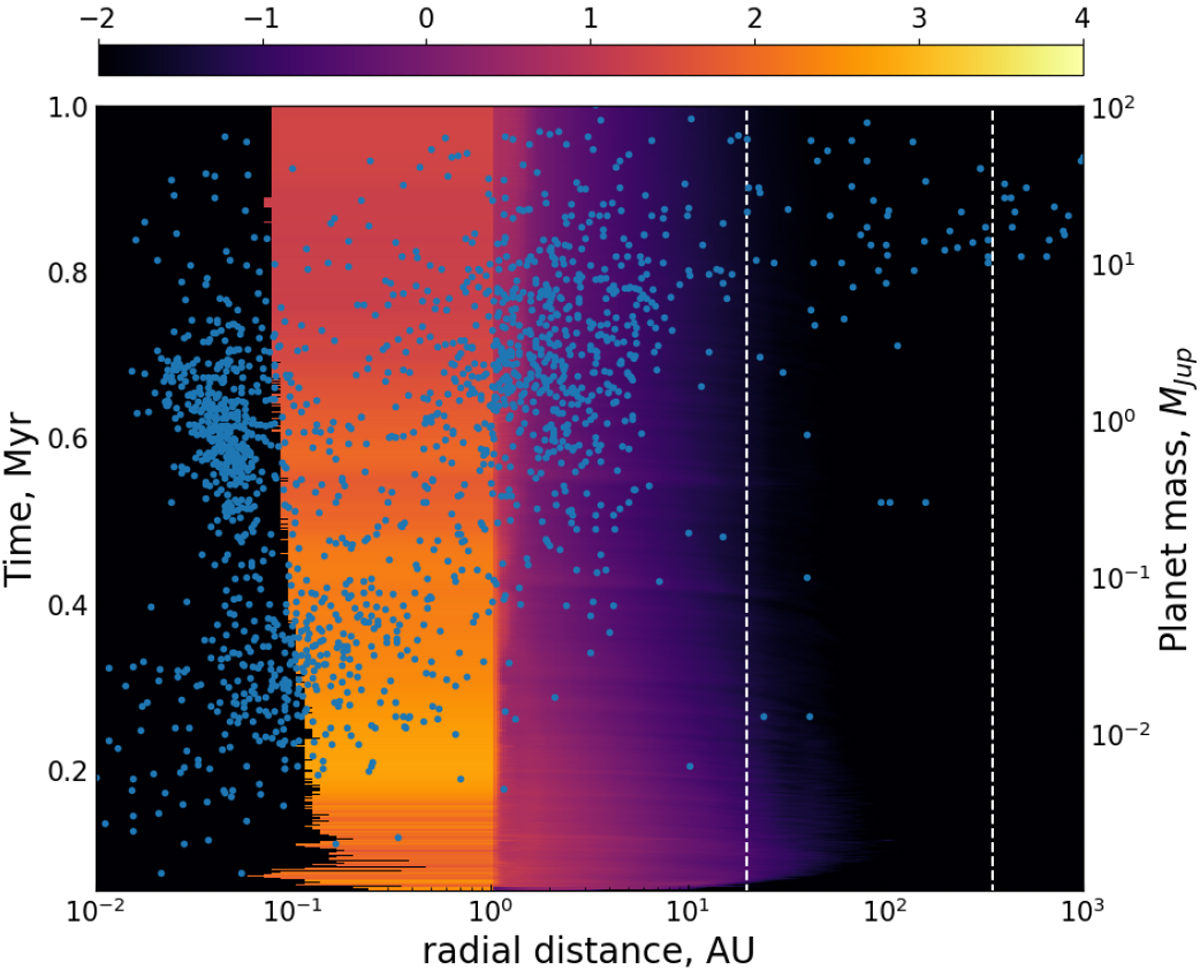
Comparison of the orbital positions of known exoplanets with the spatial distribution of grown dust as predicted by our numerical hydrodynamics models. The azimuthally averaged surface density of grown dust is plotted as a function of time using a color map. The scale bar on the top shows Σd,gr in log g cm−2. The orbital positions of known exoplanets1 are indicated with the blue circles as a function of their mass. The vertical dotted lines delineate the disk region where gas giants can be formed via gravitational fragmentation.
Current usage metrics show cumulative count of Article Views (full-text article views including HTML views, PDF and ePub downloads, according to the available data) and Abstracts Views on Vision4Press platform.
Data correspond to usage on the plateform after 2015. The current usage metrics is available 48-96 hours after online publication and is updated daily on week days.
Initial download of the metrics may take a while.