Fig. 10
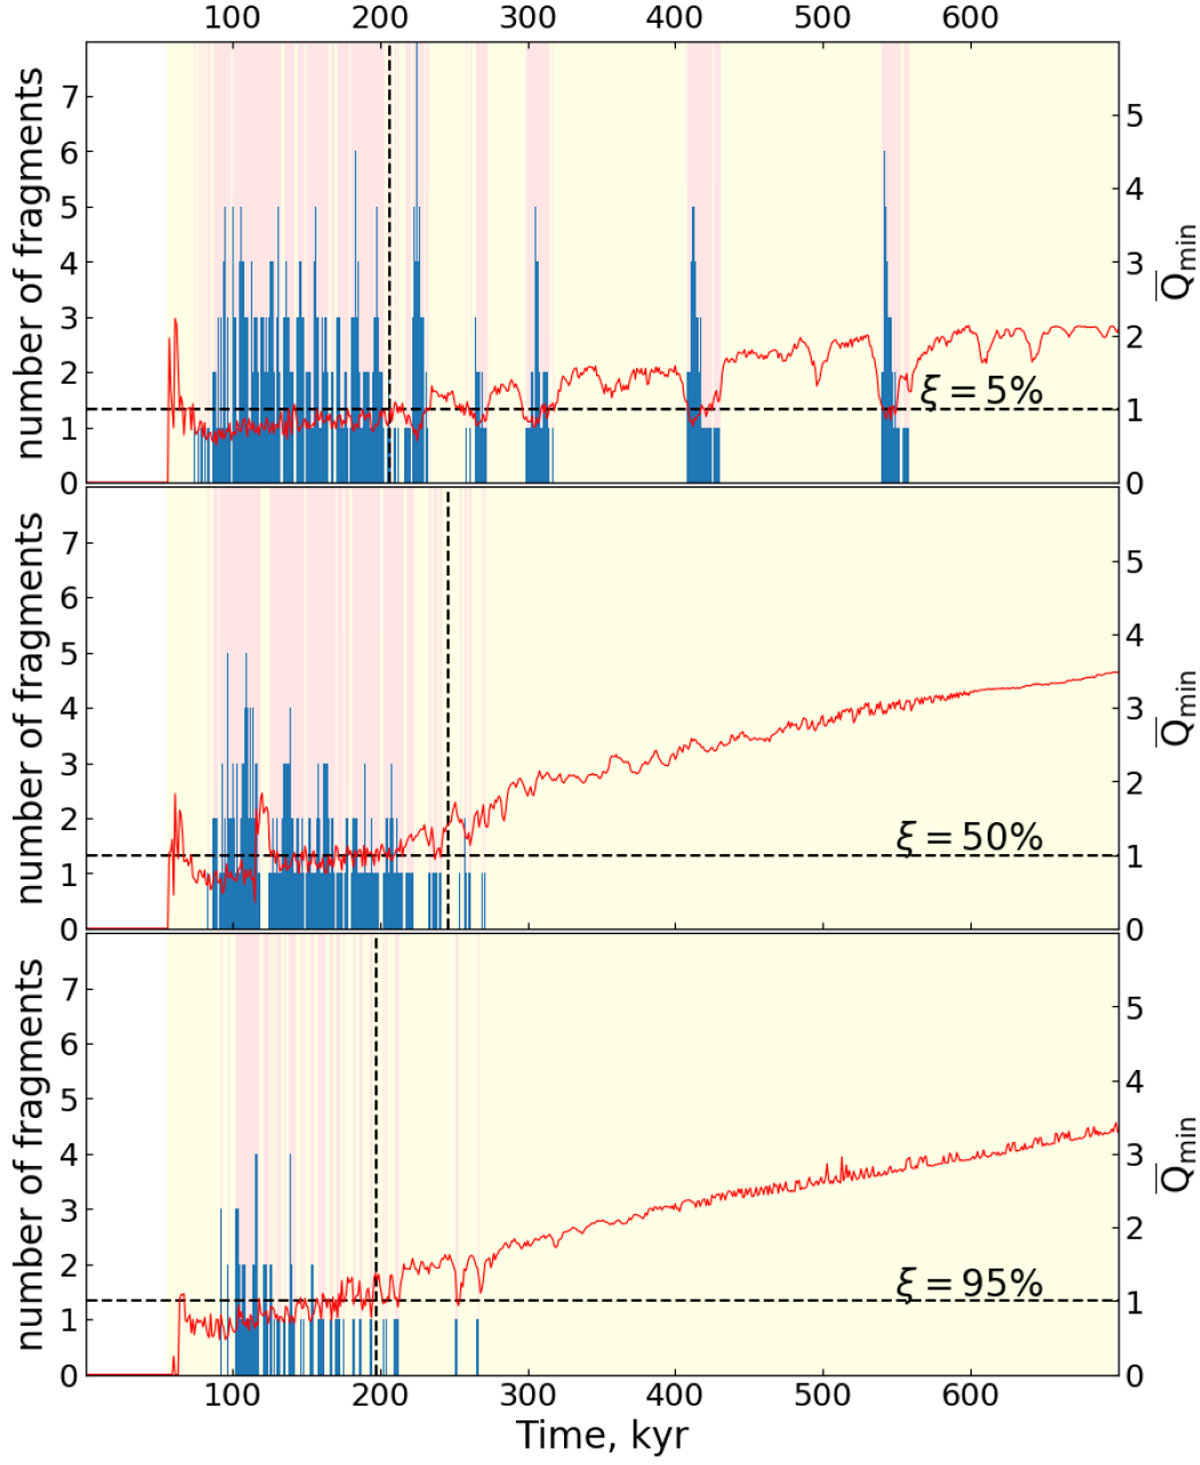
Total number of fragments present in the entire disk as a function of time in the ξ = 5% model (top panel), ξ = 50% model (middle panel), and ξ = 95% model (bottom panel). The vertical dashed lines indicate the onset of the Class II phase of disk evolution. Pink zones correspond to time periods in the Class II phase when fragments exist in the disk, and yellow zones show the time periods without any fragments in the disk. The red lines show
![]() , the mean minimum Toomre parameter in the disk.
, the mean minimum Toomre parameter in the disk.
Current usage metrics show cumulative count of Article Views (full-text article views including HTML views, PDF and ePub downloads, according to the available data) and Abstracts Views on Vision4Press platform.
Data correspond to usage on the plateform after 2015. The current usage metrics is available 48-96 hours after online publication and is updated daily on week days.
Initial download of the metrics may take a while.