Fig. 7.
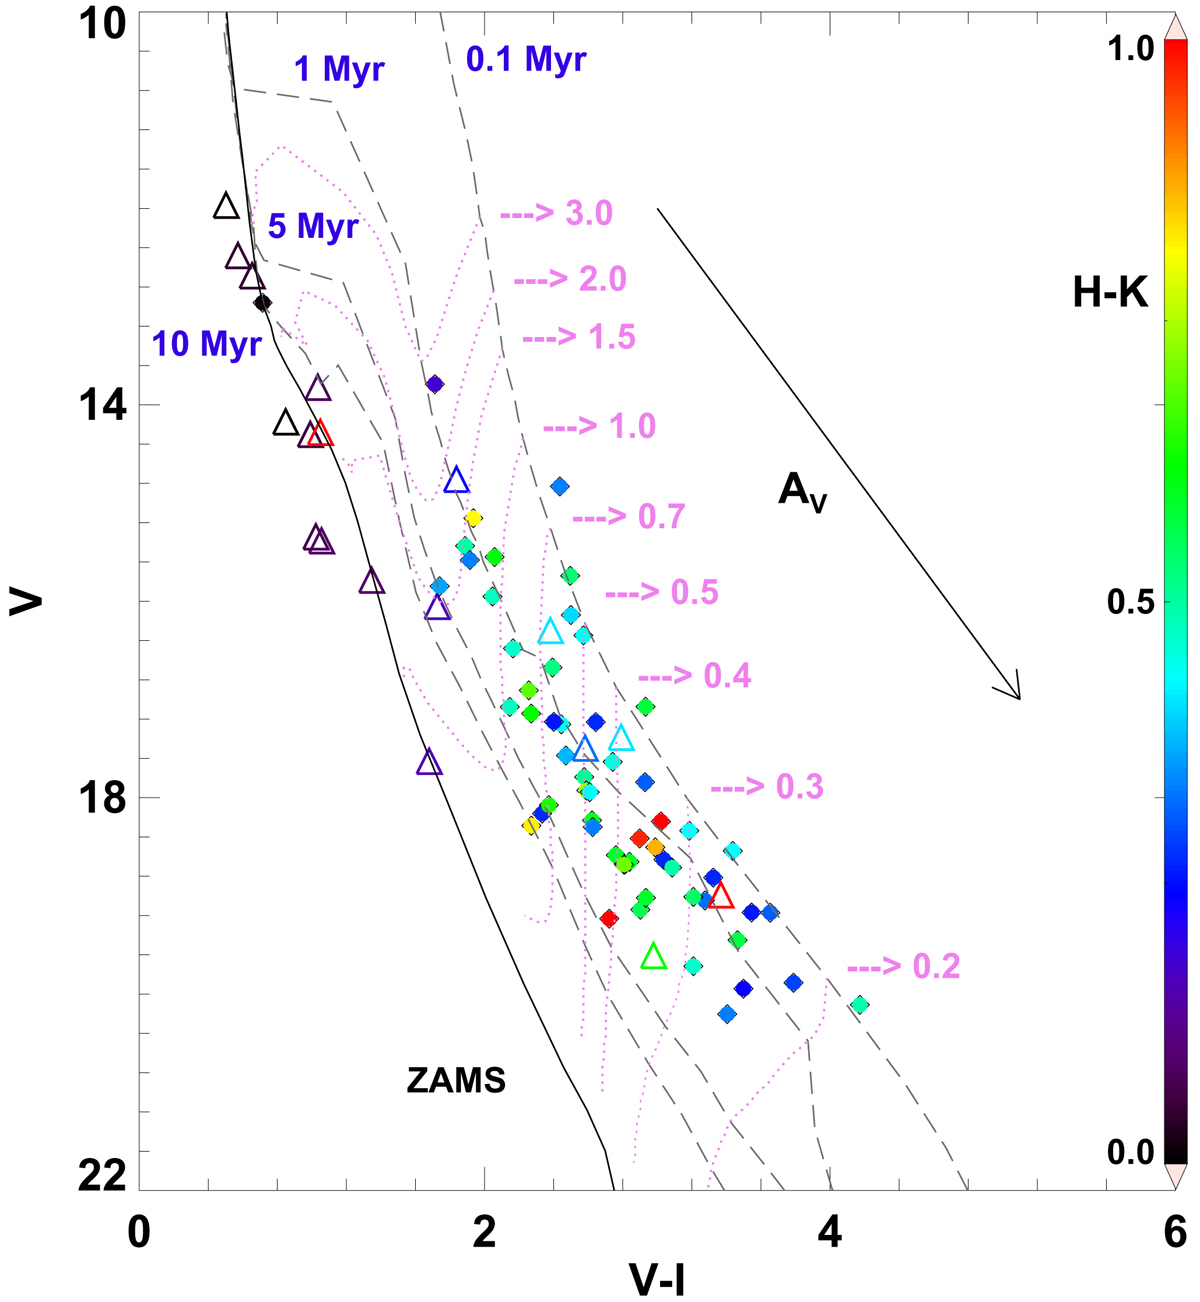
Apparent optical V/V − I CMD for the variable candidates. The dashed curve shows the isochrones for PMS stars with different ages from Siess et al. (2000), while the solid curve is the ZAMS by Girardi et al. (2002). The dotted curves display the evolutionary tracks of PMS stars with different stellar masses. The isochrones and the evolutionary tracks are offset with respect to the average distance (857.5 pc) and extinction (AV = 1.9 mag). The color bar represents the 2MASS (H − K) color. Open triangles represent the kinematic outliers. The arrow indicates the direction of the reddening vector corresponding to AV = 5 mag.
Current usage metrics show cumulative count of Article Views (full-text article views including HTML views, PDF and ePub downloads, according to the available data) and Abstracts Views on Vision4Press platform.
Data correspond to usage on the plateform after 2015. The current usage metrics is available 48-96 hours after online publication and is updated daily on week days.
Initial download of the metrics may take a while.