Fig. 6.
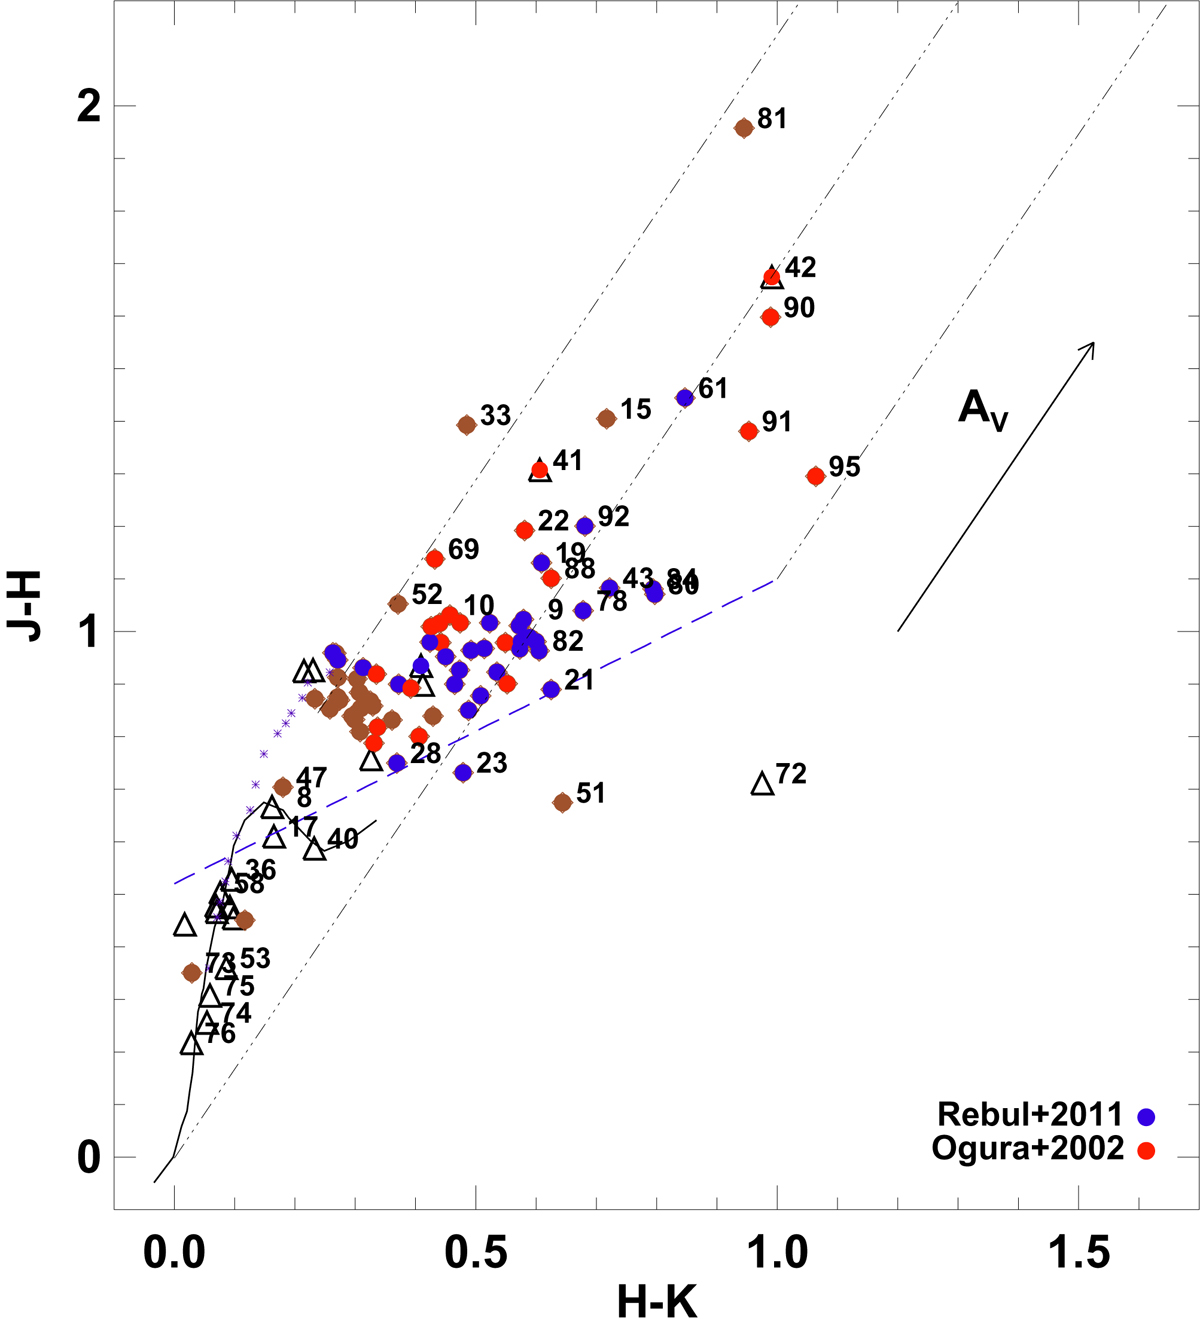
Near-infrared CCD for all variables. The solid curve and dotted curve represent the sequence of dwarf and giants from Bessell & Brett (1988). The locus of CTT stars is shown as long-dashed lines (Meyer et al. 1997), while the dot-dashed lines represent the reddening vectors (Cohen et al. 1981). Diamonds and open triangles represent the kinematic members and outliers, respectively. The solid arrow indicates reddening vector corresponding to AV = 5 mag. Each star is numbered with the last two digits of the Star ID from Table 2.
Current usage metrics show cumulative count of Article Views (full-text article views including HTML views, PDF and ePub downloads, according to the available data) and Abstracts Views on Vision4Press platform.
Data correspond to usage on the plateform after 2015. The current usage metrics is available 48-96 hours after online publication and is updated daily on week days.
Initial download of the metrics may take a while.