Fig. 4.
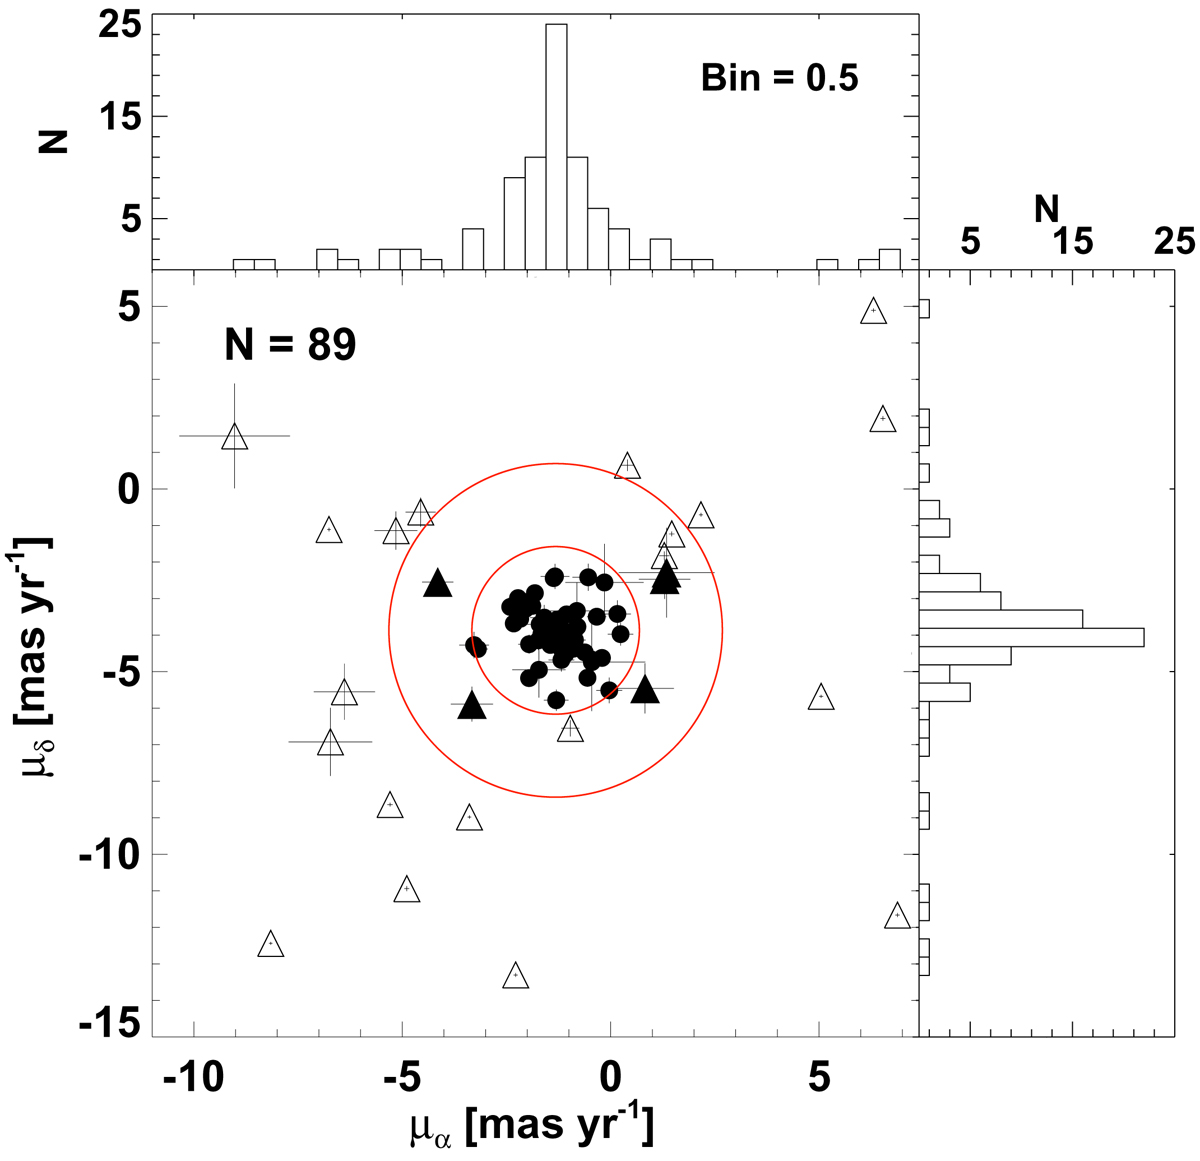
Scatterplot of variable sources in the proper motion plane. Histograms for proper motions along right ascension and declination are also shown. The center of the circles is at the peak values of proper motions from the Gaussian distribution fits to the histograms. The inner and outer radius is of 2 and 4 mas per year, respectively. Filled circles denote kinematically selected members. Open triangles represent 3σ (∼2 mas per year) outliers from the mean of the Gaussian distribution fits to the histograms of the proper motions. Filled triangles display variables for which the proper motions are consistent with the mean value given their 3σ uncertainties. The bin size used in the histograms and the number of stars shown are indicated at the top.
Current usage metrics show cumulative count of Article Views (full-text article views including HTML views, PDF and ePub downloads, according to the available data) and Abstracts Views on Vision4Press platform.
Data correspond to usage on the plateform after 2015. The current usage metrics is available 48-96 hours after online publication and is updated daily on week days.
Initial download of the metrics may take a while.