Fig. 2.
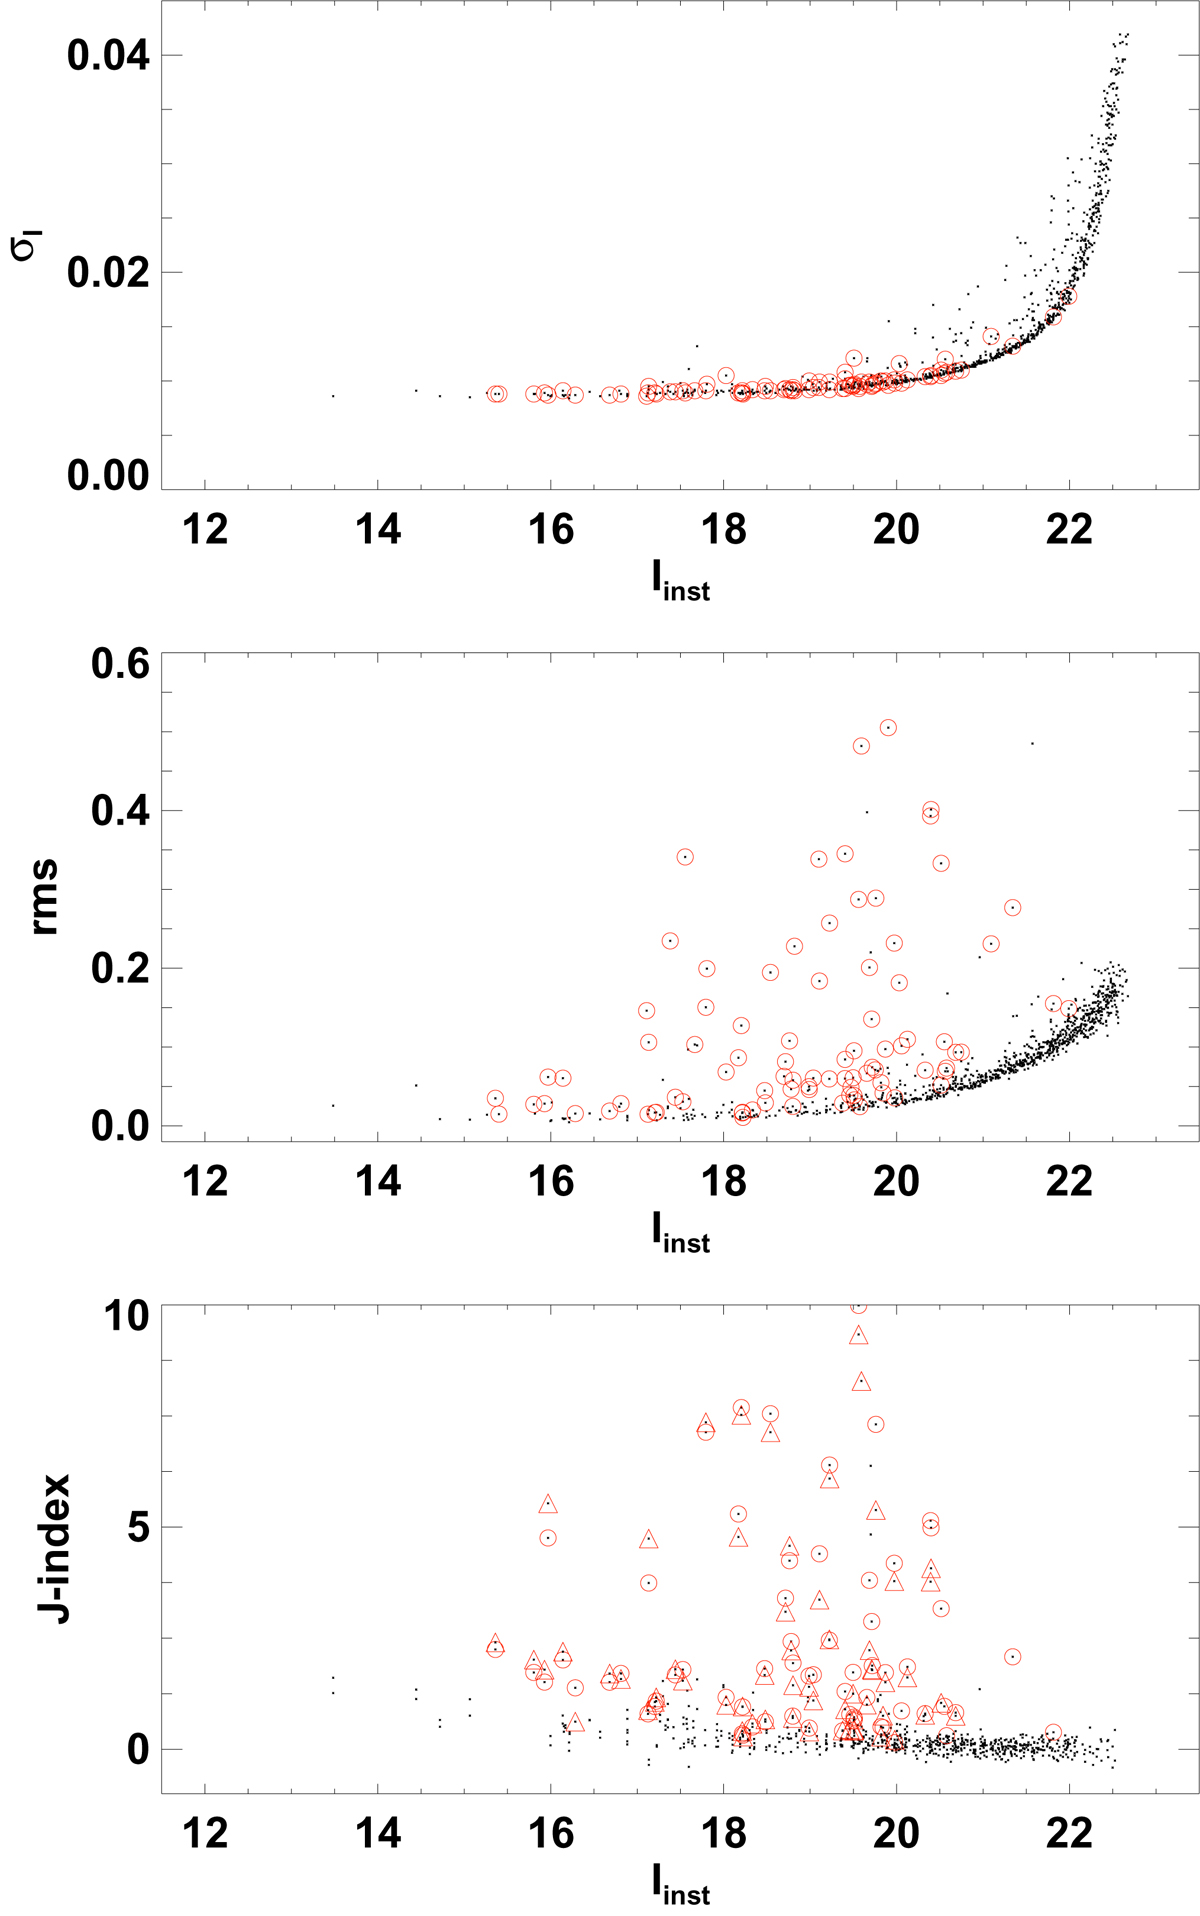
Top panel: photometric precision of our observations in I band as a function of instrumental magnitudes. Middle panel: root mean square (rms) scatter in I band as a function of instrumental magnitudes. Red circles denote the selected candidate variables in the top and middle panels. Bottom panel: Stetson’s J-index for all sources in our field as a function of instrumental I-band magnitudes. Red circles and triangles represent the variables with light curves available in RI and VI bands.
Current usage metrics show cumulative count of Article Views (full-text article views including HTML views, PDF and ePub downloads, according to the available data) and Abstracts Views on Vision4Press platform.
Data correspond to usage on the plateform after 2015. The current usage metrics is available 48-96 hours after online publication and is updated daily on week days.
Initial download of the metrics may take a while.