Free Access
Fig. 10.
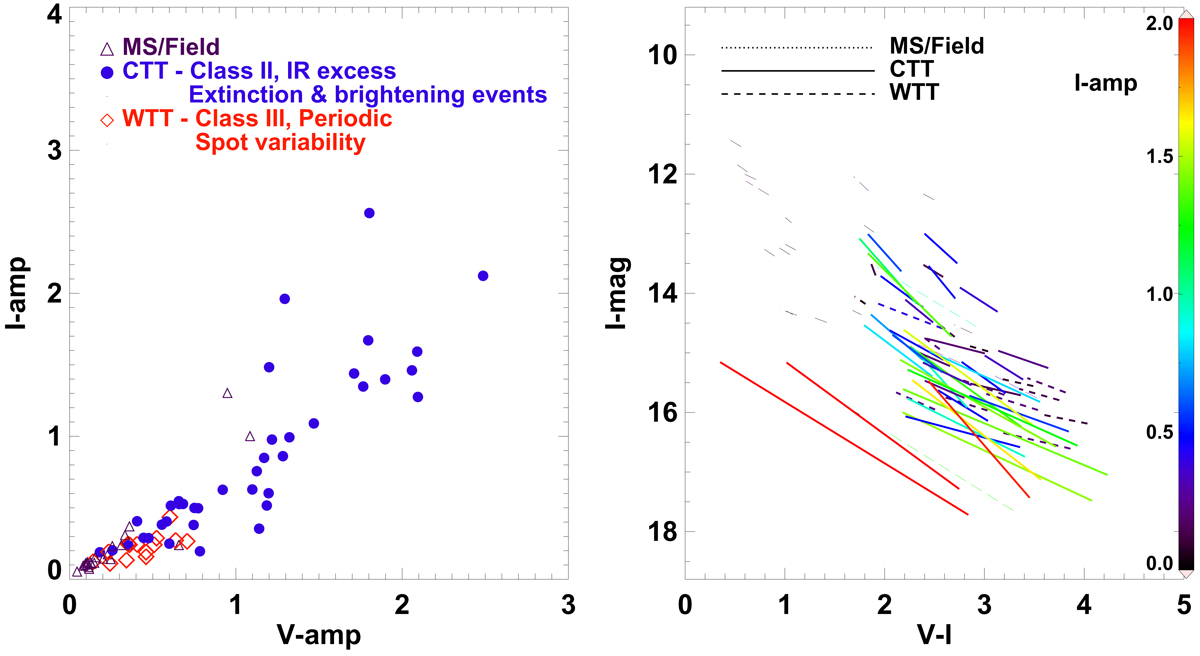
Left panel: variation in V- and I-band amplitudes for all variables. Right panel: variability in the amplitude-color plane plotted in the CMD. Variation along I-mag is the difference between maximum and minimum, while (V − I) represents the range of the color curve. The color bar shows the ranges of I-band magnitudes.
Current usage metrics show cumulative count of Article Views (full-text article views including HTML views, PDF and ePub downloads, according to the available data) and Abstracts Views on Vision4Press platform.
Data correspond to usage on the plateform after 2015. The current usage metrics is available 48-96 hours after online publication and is updated daily on week days.
Initial download of the metrics may take a while.