Fig. 3.
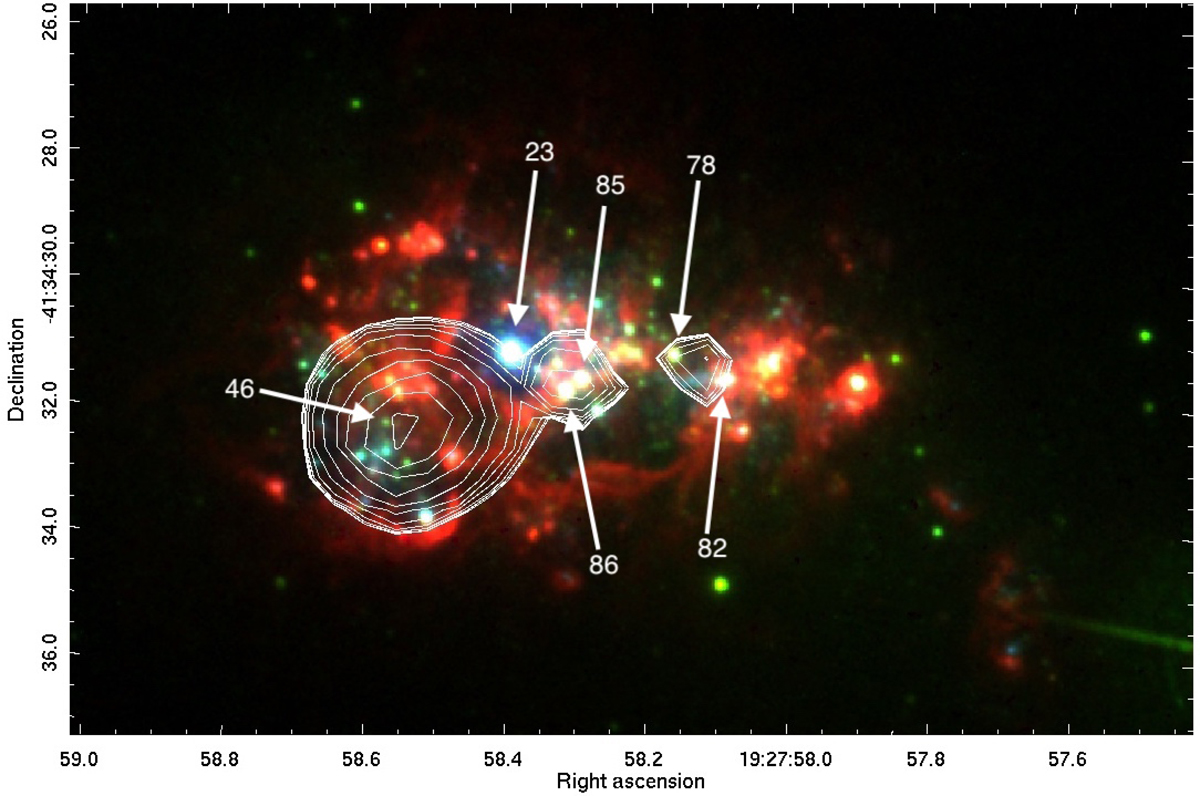
HST colour composite image of ESO 338-4. The blue shows the image in F140LP UV filter, highlighting the youngest star clusters, green is the F550M filter, and red is the FR656N images centred on the Hα emission line, highlighting the distribution of the ionized gas. Overplotted in white are logarithmically spaced contours tracing the smoothed Chandra X-ray image. Three detected X-ray sources, X-1, X-2, and X-3, are aligned from left to right. The numbered arrows indicate the positions of star clusters that might be associated with the X-ray sources (see discussion in Sect. 2.3 and Table 2.)
Current usage metrics show cumulative count of Article Views (full-text article views including HTML views, PDF and ePub downloads, according to the available data) and Abstracts Views on Vision4Press platform.
Data correspond to usage on the plateform after 2015. The current usage metrics is available 48-96 hours after online publication and is updated daily on week days.
Initial download of the metrics may take a while.