Open Access
Fig. 8.
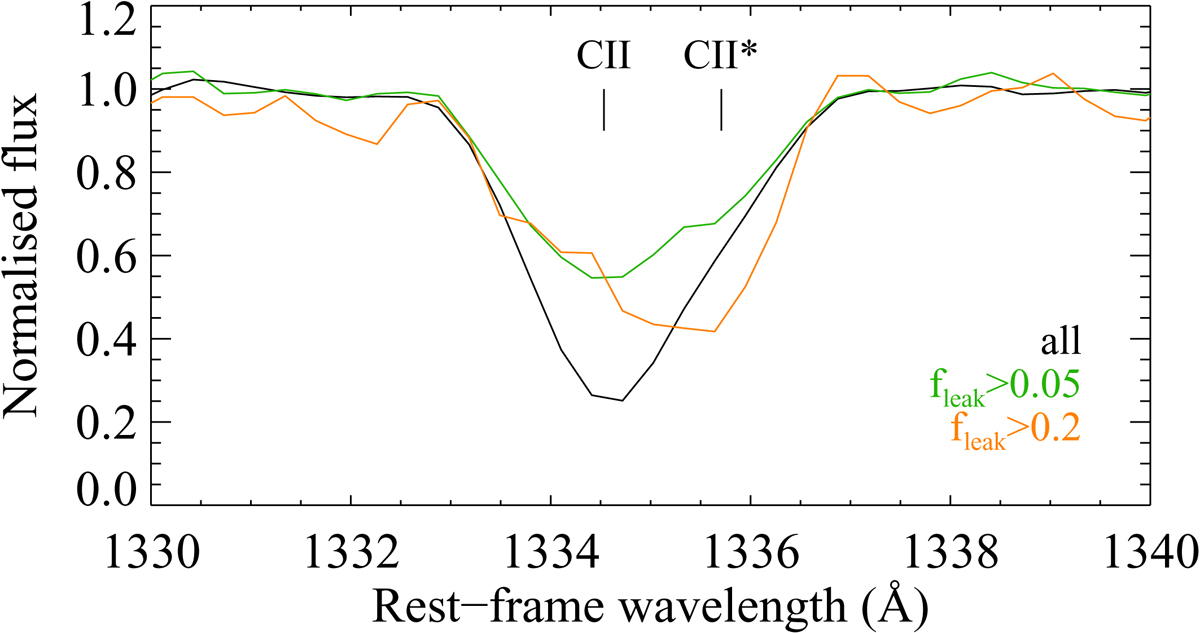
Median spectra around the C II λ 1334 line for all grade-A systems (black) compared with sub-samples with fleak > 0.05 (green) and fleak > 0.2 (orange). The spectra are boxcar smoothed by 3 pixels for presentation purposes.
Current usage metrics show cumulative count of Article Views (full-text article views including HTML views, PDF and ePub downloads, according to the available data) and Abstracts Views on Vision4Press platform.
Data correspond to usage on the plateform after 2015. The current usage metrics is available 48-96 hours after online publication and is updated daily on week days.
Initial download of the metrics may take a while.