Fig. 5.
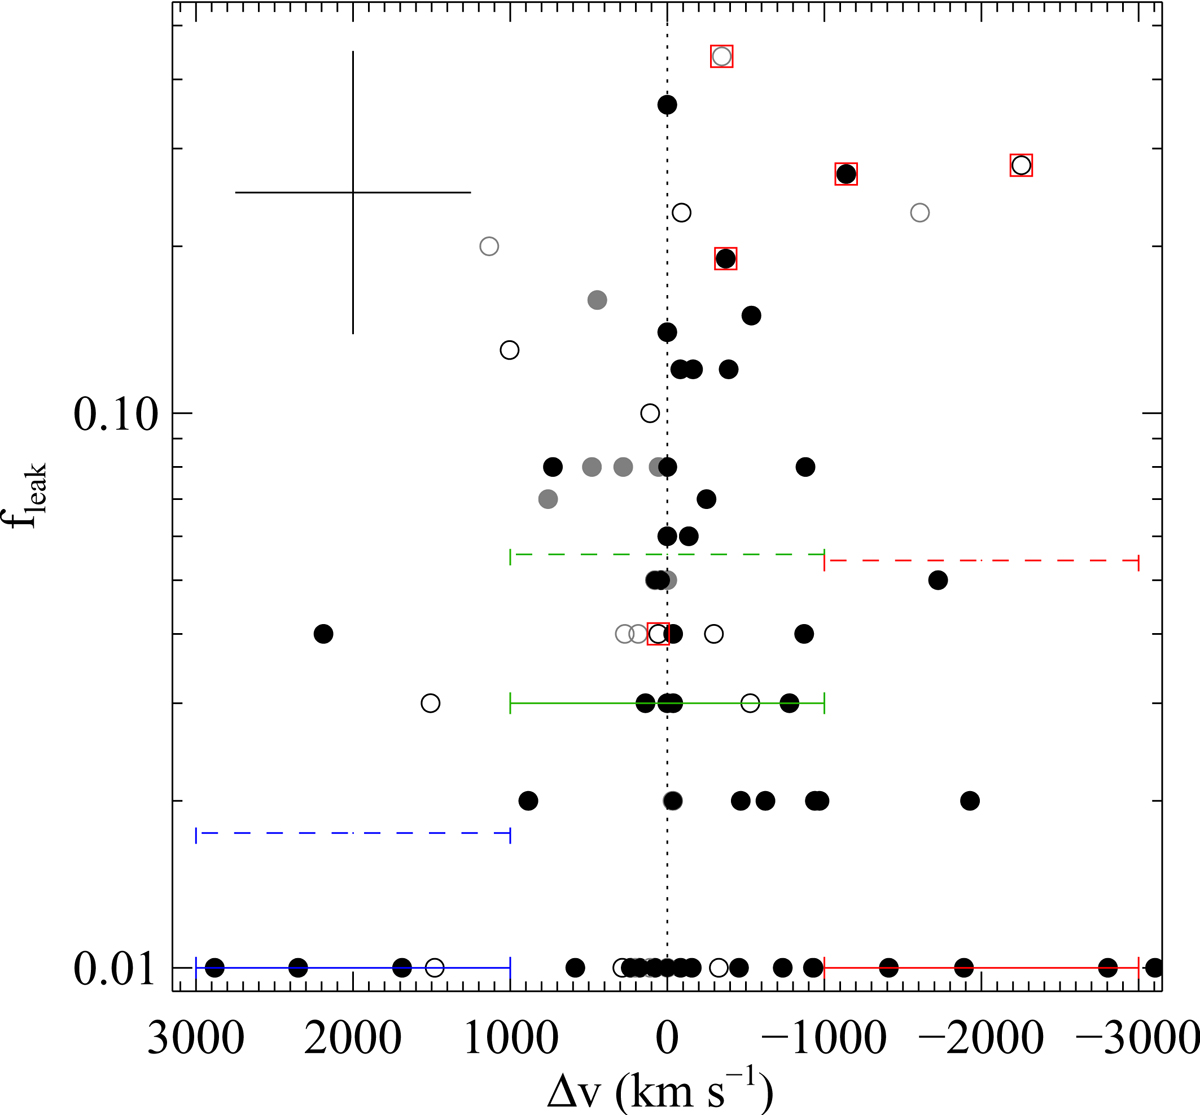
Fraction of leaking Ly-α photons at the core of the DLAs as a function of its relative velocity to the quasar redshift. Filled points correspond to systems from the two statistical selections described in Sect. 2 (flag ≠0 in Table 1). Unfilled symbols correspond to the additional systems described in Sect. 2.4 (flag = 0). The colour indicates the visual classification (black:A, grey:B). Finally, red squares are overplotted on top of systems with clear Si II* absorption. The solid (resp. dashed) segments correspond to the median (resp. mean) values in different velocity bins, using only statistical rank A systems. Values measured to be less than 0.01 are set to 0.01 for plotting convenience. The cross at the top-left corner shows typical (albeit conservative) uncertainties along both axes.
Current usage metrics show cumulative count of Article Views (full-text article views including HTML views, PDF and ePub downloads, according to the available data) and Abstracts Views on Vision4Press platform.
Data correspond to usage on the plateform after 2015. The current usage metrics is available 48-96 hours after online publication and is updated daily on week days.
Initial download of the metrics may take a while.