Fig. 3.
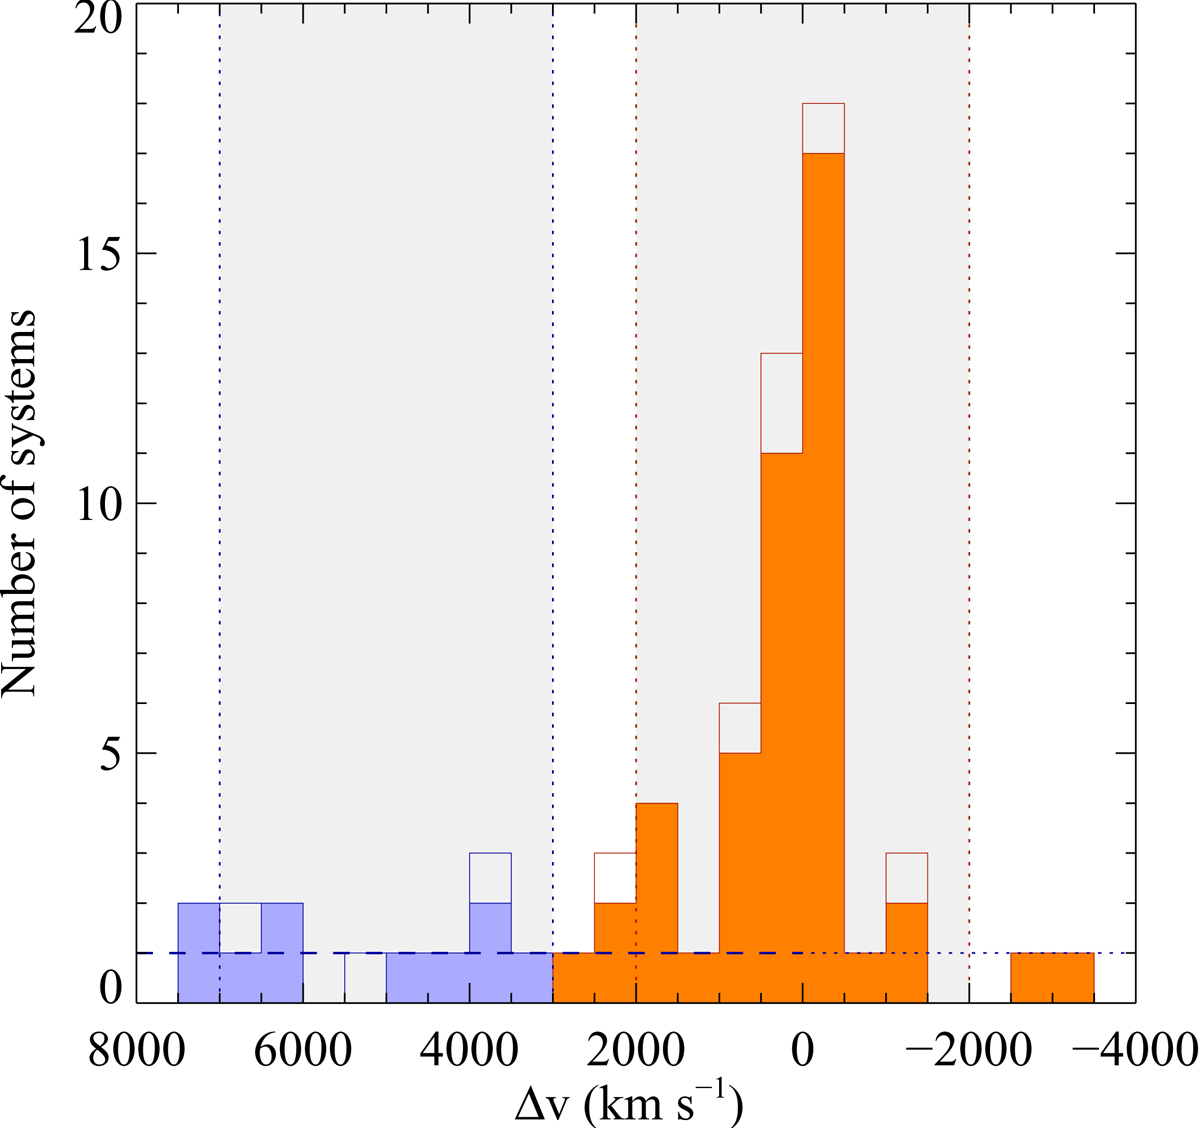
Distribution of relative velocities with respect to the quasar redshift for our sample of strong proximate H2 systems (orange histograms) compared to those found in a region shifted by 5000 km s−1 (blue). We here used the “zbest” provided by the DR14Q catalogue as the quasar redshift and the zabs measurement directly from our search algorithm. Negative velocities indicate zabs > zem. Note that the x-axis goes from positive velocities (blueshifted compared to the quasar) on the left to negative velocities (redshifted) to the right. Both distributions are restricted to visually-checked systems (unfilled histograms: grade A or B, filled histograms: grade A only) isolated using the outlier selection (# 2). The grey regions show the corresponding minimal search windows. Systems falling outside these regions are not considered when comparing incidence rates. The horizontal dashed line shows the mean number of intervening strong H2 systems per velocity bin (∼1 per 500 km s−1 bin). A significant excess of H2 systems at the quasar redshift is observed and cannot be explained by intervening statistics.
Current usage metrics show cumulative count of Article Views (full-text article views including HTML views, PDF and ePub downloads, according to the available data) and Abstracts Views on Vision4Press platform.
Data correspond to usage on the plateform after 2015. The current usage metrics is available 48-96 hours after online publication and is updated daily on week days.
Initial download of the metrics may take a while.