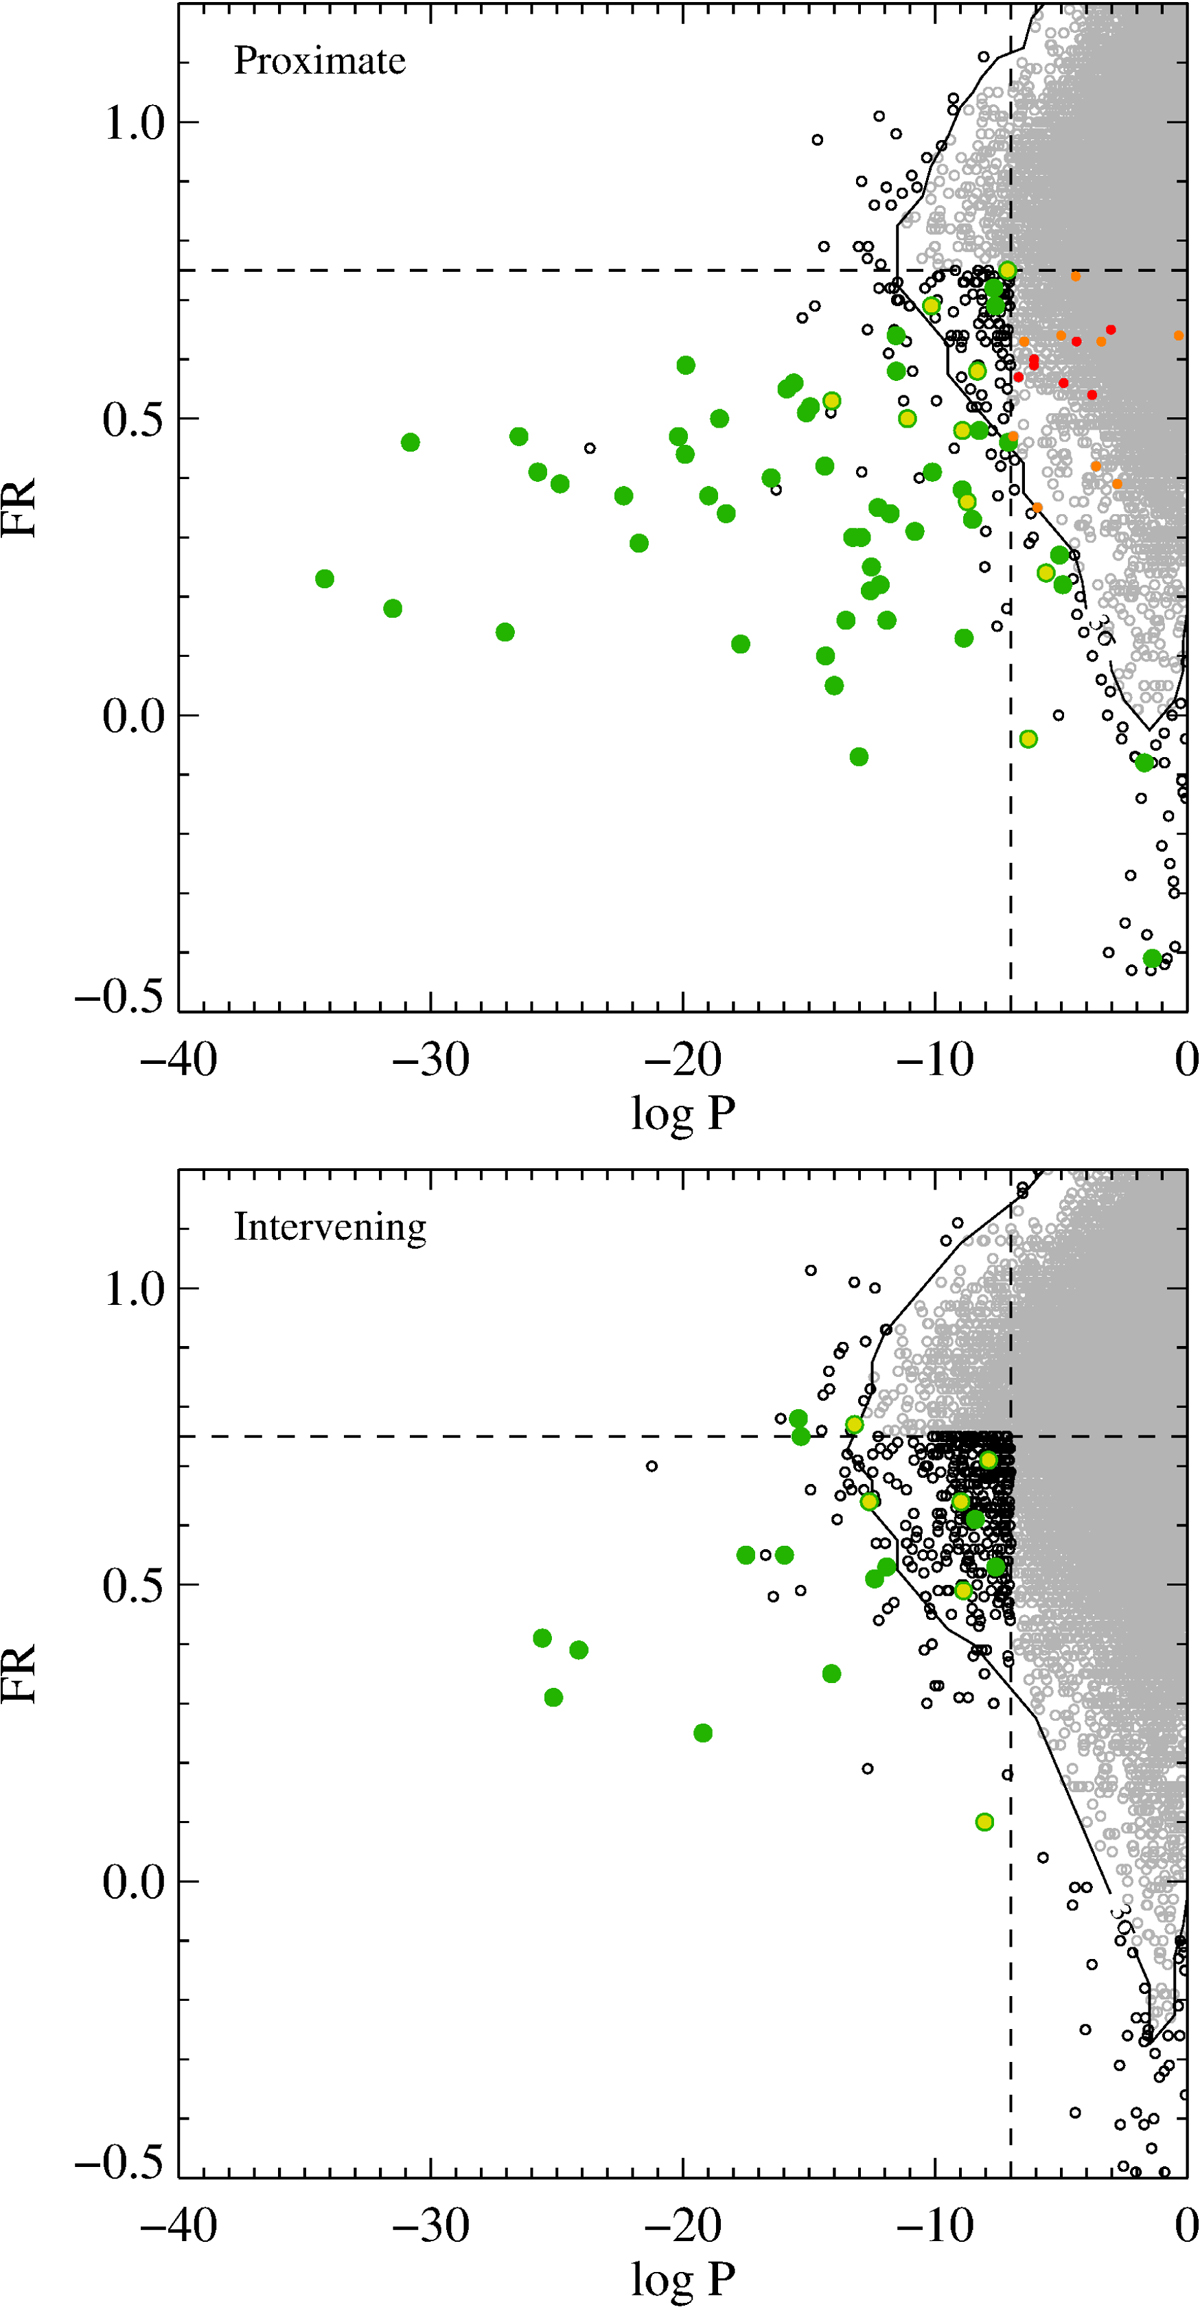
Fig. 2.

Core-to-continuum median flux ratio versus significance of the Spearman correlation for all quasar spectra searched in a proximate velocity window (top, within a velocity window encompassing the pipeline and visual redshifts estimates, extended 2000 km s−1 on each side) and an intervening window with the exact same width for each spectrum, but shifted by 5000 km s−1 bluewards (bottom). The vertical and horizontal dotted lines show our cuts defining the samples ![]() (top) and
(top) and ![]() (bottom). Points located outside the solid contour (containing 99.73% of the points) define, respectively,
(bottom). Points located outside the solid contour (containing 99.73% of the points) define, respectively, ![]() (top) and
(top) and ![]() (bottom). Candidates belonging to either one or both of these selections (black points) were visually checked and coloured green when strong H2 is confirmed (grade A) or yellow when considered tentative only (grade B). Red and orange points correspond to additional systems described in Sect. 2.4 with, respectively, grade A and B.
(bottom). Candidates belonging to either one or both of these selections (black points) were visually checked and coloured green when strong H2 is confirmed (grade A) or yellow when considered tentative only (grade B). Red and orange points correspond to additional systems described in Sect. 2.4 with, respectively, grade A and B.
Current usage metrics show cumulative count of Article Views (full-text article views including HTML views, PDF and ePub downloads, according to the available data) and Abstracts Views on Vision4Press platform.
Data correspond to usage on the plateform after 2015. The current usage metrics is available 48-96 hours after online publication and is updated daily on week days.
Initial download of the metrics may take a while.


