Open Access
Fig. A.1.
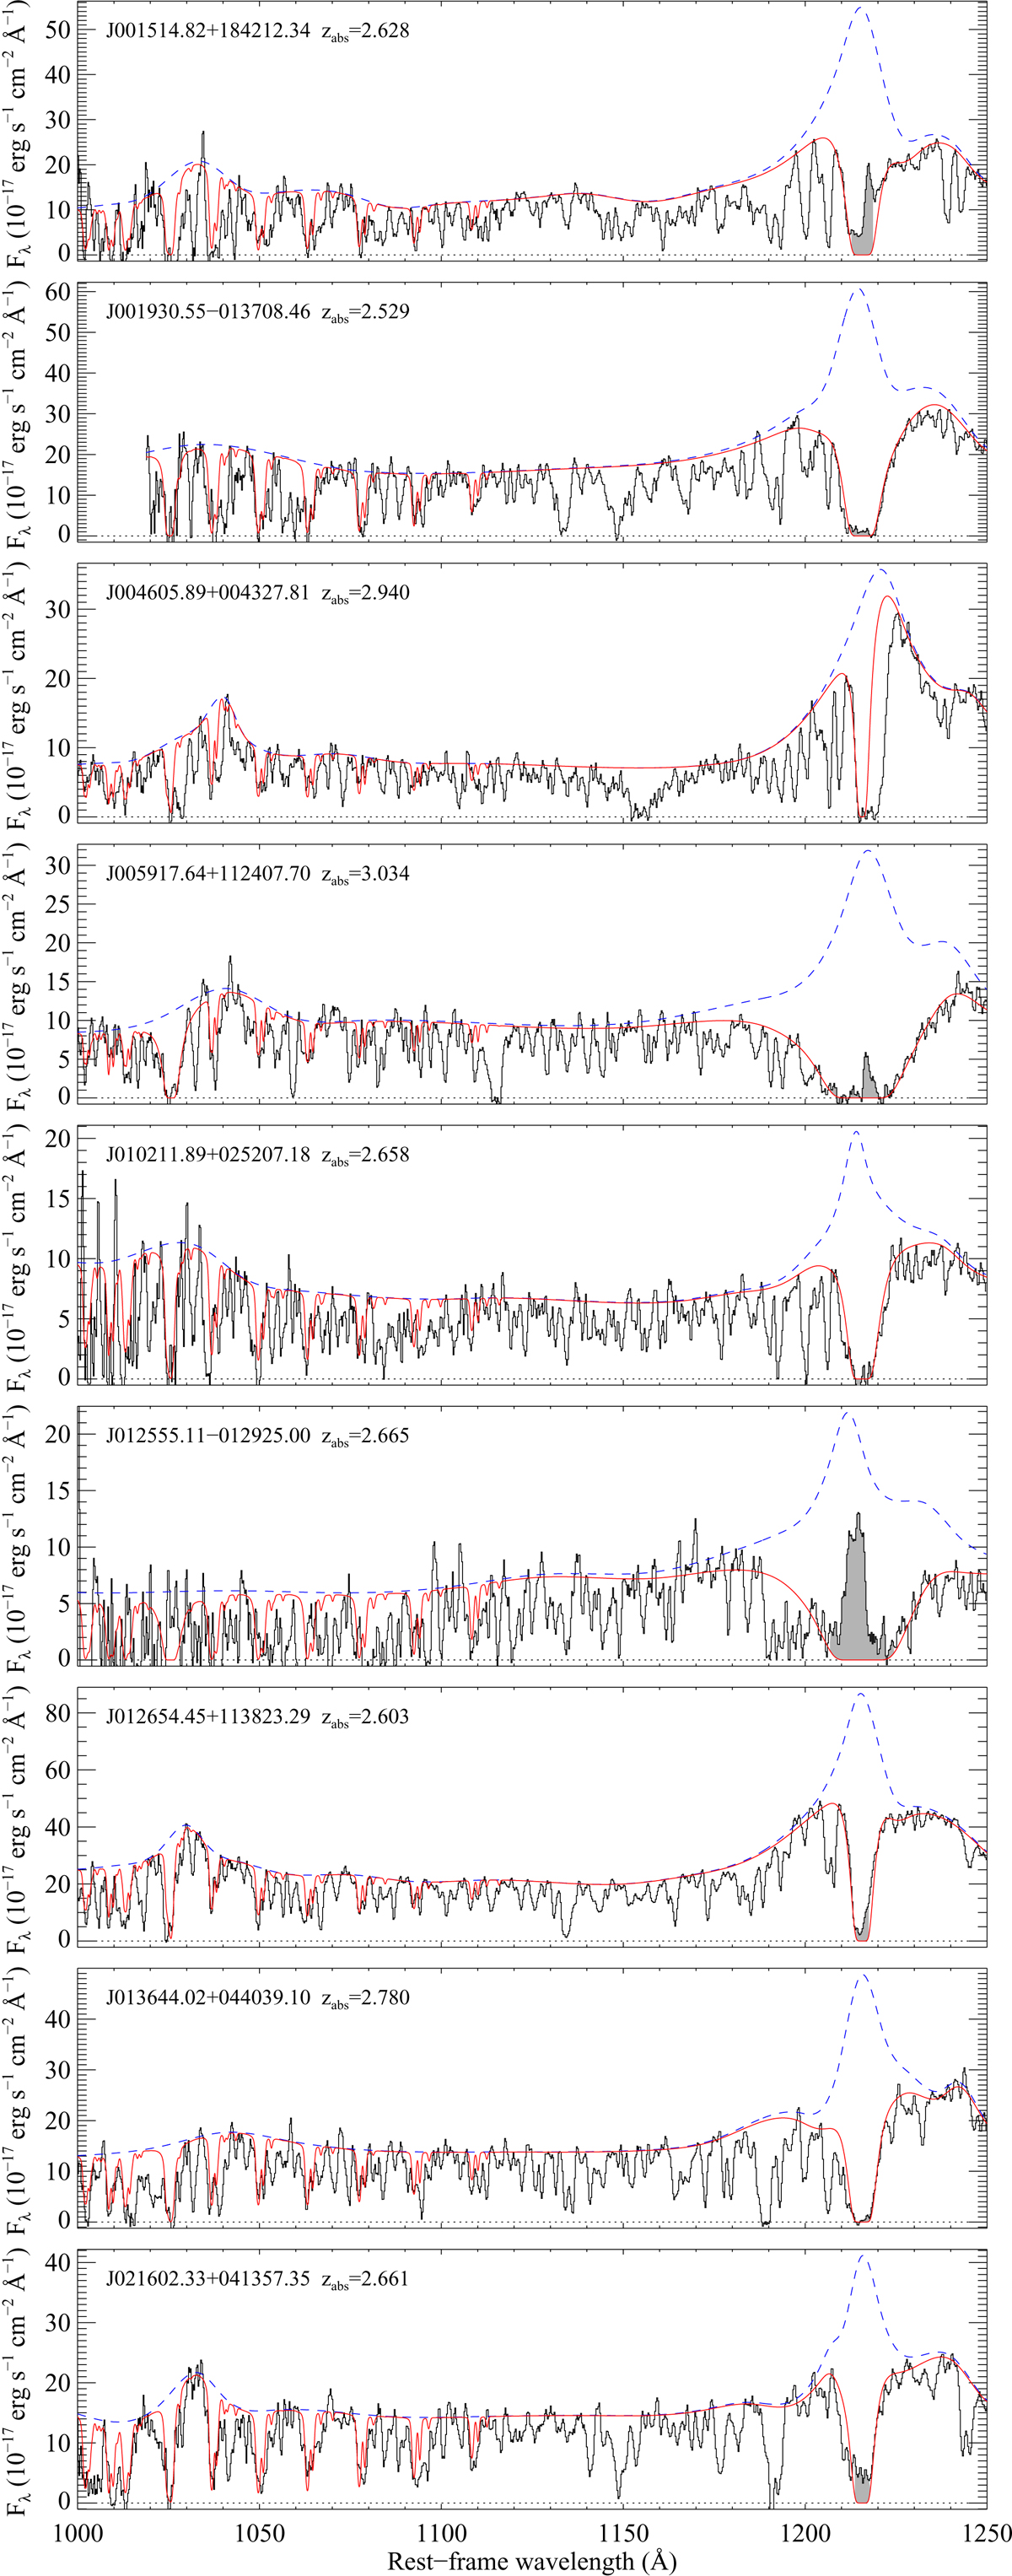
Proximate H2 systems. The panels show a portion of the SDSS spectra (black), shifted at the quasar rest-frame. The estimated unabsorbed quasar spectrum is shown as dashed blue curve. The synthetic H I + H2 profile is overplotted in red. The shaded area in the core of the PDLA highlights the leaking flux.
Current usage metrics show cumulative count of Article Views (full-text article views including HTML views, PDF and ePub downloads, according to the available data) and Abstracts Views on Vision4Press platform.
Data correspond to usage on the plateform after 2015. The current usage metrics is available 48-96 hours after online publication and is updated daily on week days.
Initial download of the metrics may take a while.