Fig. 1.
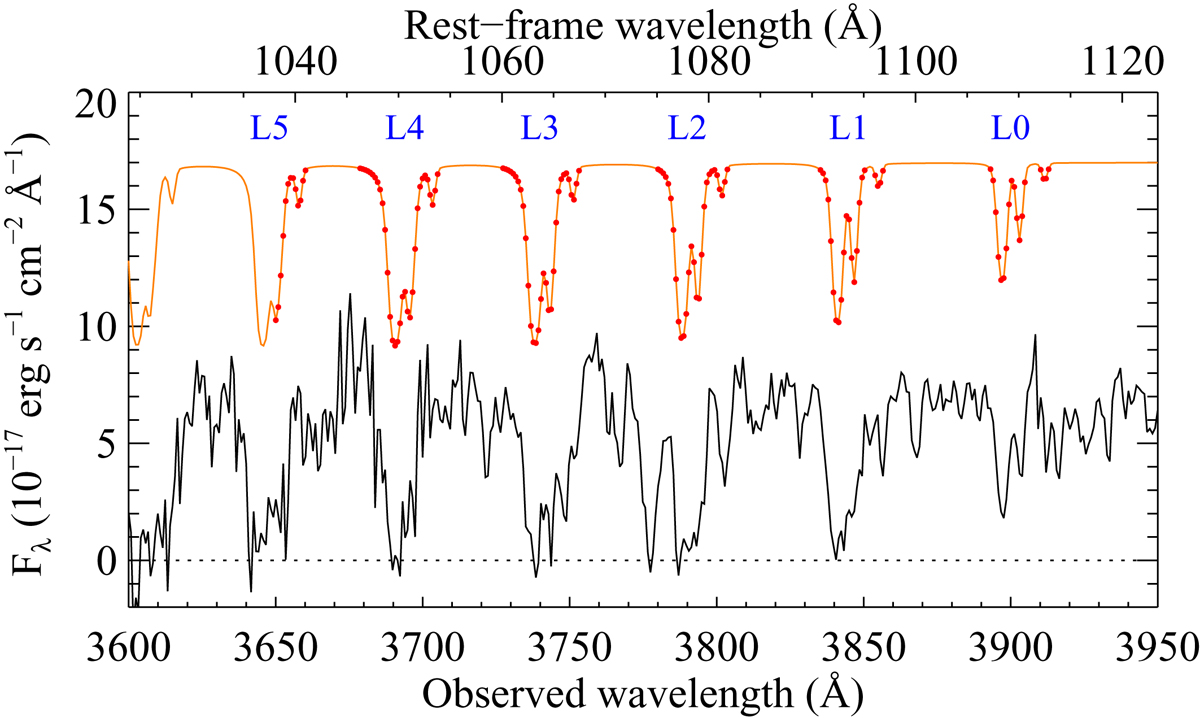
Portion of the SDSS spectrum of quasar J 1031+2240 (black) with detected H2 lines. The H2 template is shown in orange arbitrarily scaled and shifted above the observed spectrum for visual clarity. The pixels used here to calculate the Spearman’s correlation are highlighted by red dots. The blue label on the top of each Lyman (L) band indicates the vibrational level of the upper-state of that band.
Current usage metrics show cumulative count of Article Views (full-text article views including HTML views, PDF and ePub downloads, according to the available data) and Abstracts Views on Vision4Press platform.
Data correspond to usage on the plateform after 2015. The current usage metrics is available 48-96 hours after online publication and is updated daily on week days.
Initial download of the metrics may take a while.