Fig. 8.
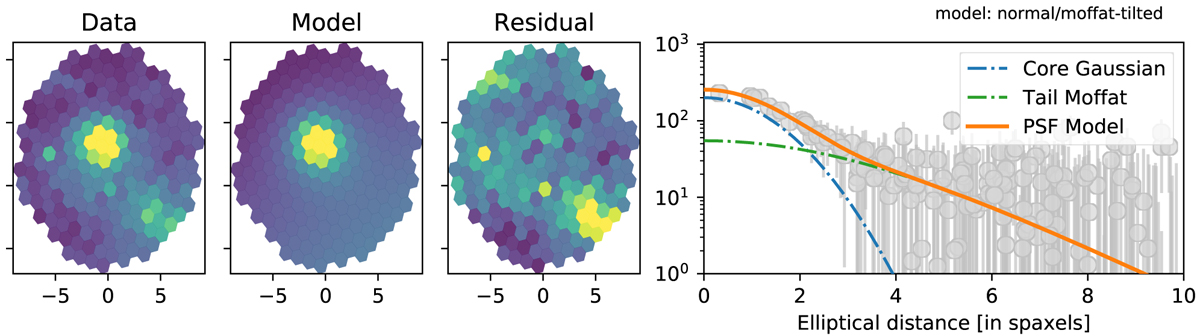
Illustration of the PSF model used to extract to target point source from the cubes 3D, here showing the slice [5000, 5500] Å of the part of ZTF18abqlpgq’s x, y, λ-cube used for PSF fitting (see text). From left to right: data slice, model slice (PSF+tilted-plane background), residual slice and PSF profile. The PSF profile axes on the right hand side present the background-subtracted spaxel flux (gray marker with error bars) [in pseudo-ADU, see text] as a function of the elliptical distance to the best fitted center of the PSF. The orange curve is the best fitted PSF profile, decomposed into Moffat (green) and Gaussian (blue). The small structure visible on the lower right of the residual slice panel is the host galaxy signal (see Fig. 5).
Current usage metrics show cumulative count of Article Views (full-text article views including HTML views, PDF and ePub downloads, according to the available data) and Abstracts Views on Vision4Press platform.
Data correspond to usage on the plateform after 2015. The current usage metrics is available 48-96 hours after online publication and is updated daily on week days.
Initial download of the metrics may take a while.