Fig. 7.
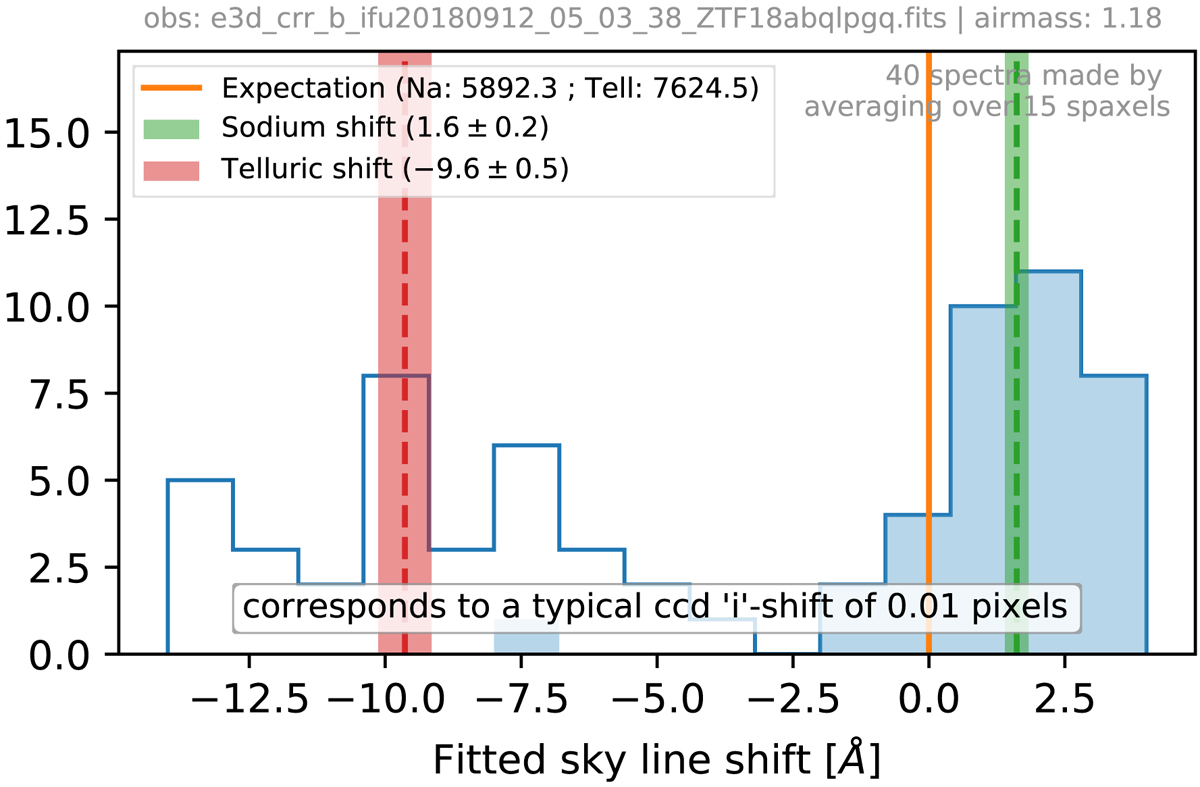
Illustration of the horizontal wavelength flexure procedure; here a science observation of ZTF18abqlpgq. Histograms show the measured wavelength shift between expected and measured sky sodium lines (blue) and telluric absorption (white). The measurements are made on the 600 faintest spaxels (∼ half of the MLA) into 40 spectra averaging 15 spaxels. The orange vertical bar shows the average shift in wavelength. The text indicates the conversion in terms of horizontal pixels. In the illustrative case there is barely any wavelength flexure correction, which rarely exceeds a fraction of a pixel.
Current usage metrics show cumulative count of Article Views (full-text article views including HTML views, PDF and ePub downloads, according to the available data) and Abstracts Views on Vision4Press platform.
Data correspond to usage on the plateform after 2015. The current usage metrics is available 48-96 hours after online publication and is updated daily on week days.
Initial download of the metrics may take a while.