Fig. 6.
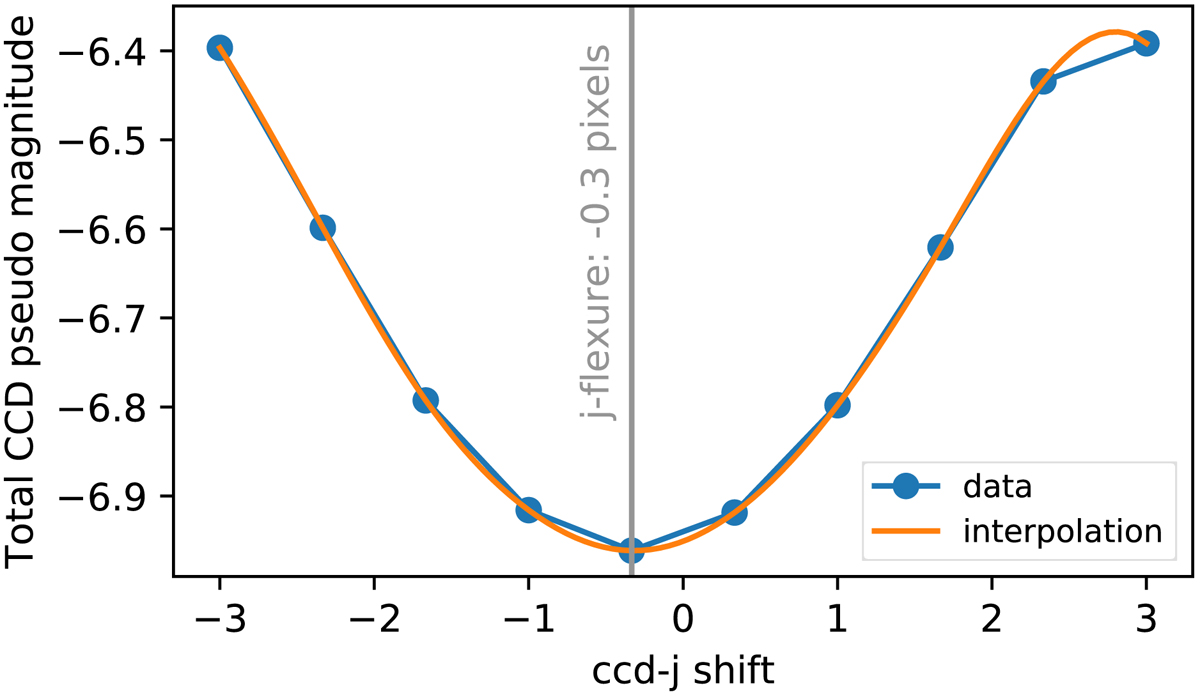
Illustration of the vertical trace flexure procedure; here a science observation of ZTF18abqlpgq. Blue markers show the pseudo-magnitude computed inside the spaxel traces, the lower the brighter. The orange curve is a cubic spline interpolator. The gray vertical bar shows the minimum of the cubic interpolation. In this illustrative case, the dome-based trace mask must be shifted by −0.3 pixels to account for vertical flexure.
Current usage metrics show cumulative count of Article Views (full-text article views including HTML views, PDF and ePub downloads, according to the available data) and Abstracts Views on Vision4Press platform.
Data correspond to usage on the plateform after 2015. The current usage metrics is available 48-96 hours after online publication and is updated daily on week days.
Initial download of the metrics may take a while.