Fig. 4.
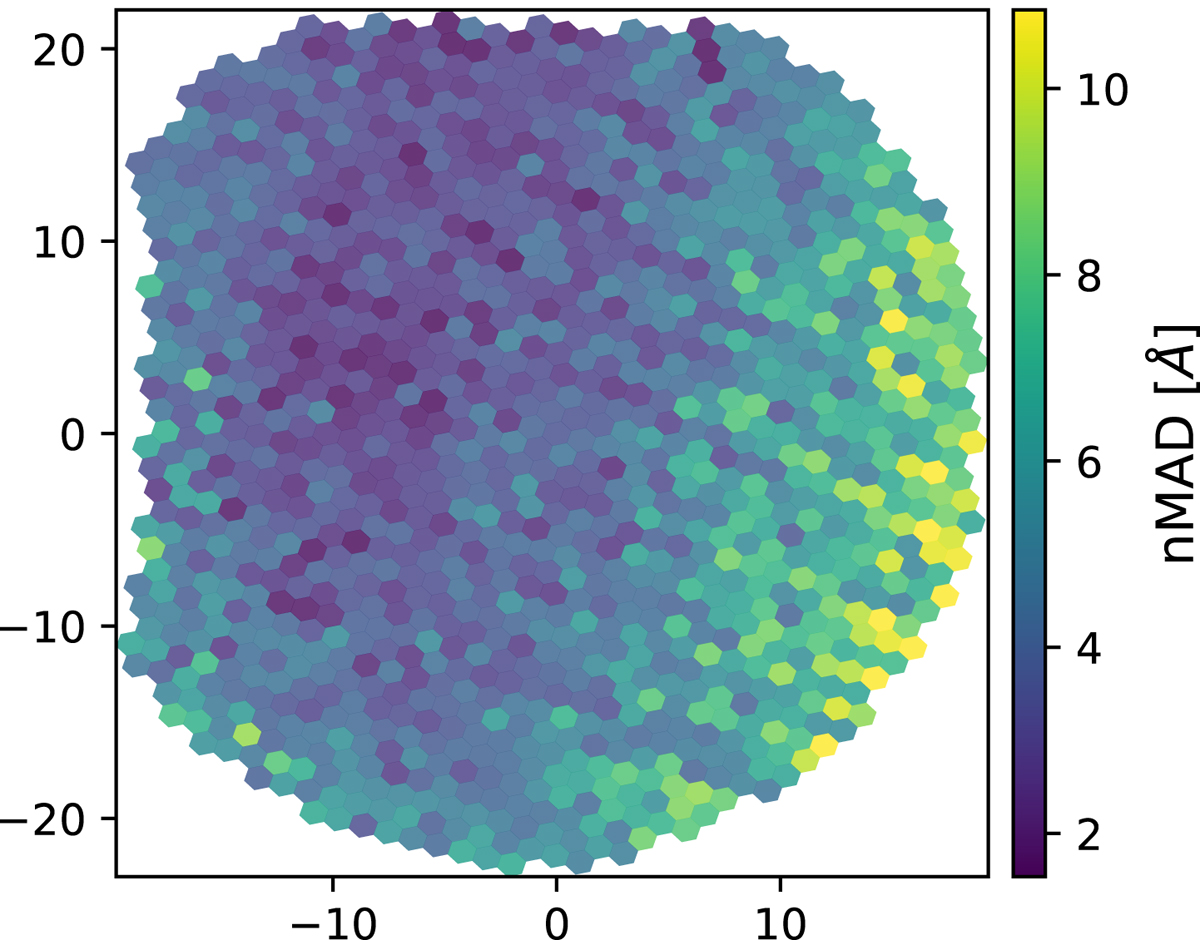
Illustration of the precision of the wavesolution procedure. The color of each spaxel corresponds to the normalized median average distance (nMAD) of measured arc lines around the wavelength solution. As discussed in the text, the meaningful information is the relative precision between spaxels: our wavelength solution is better toward the center of the IFU, where the signal-to-noise ratio is higher, and science targets are designed to be located.
Current usage metrics show cumulative count of Article Views (full-text article views including HTML views, PDF and ePub downloads, according to the available data) and Abstracts Views on Vision4Press platform.
Data correspond to usage on the plateform after 2015. The current usage metrics is available 48-96 hours after online publication and is updated daily on week days.
Initial download of the metrics may take a while.