Fig. 3.
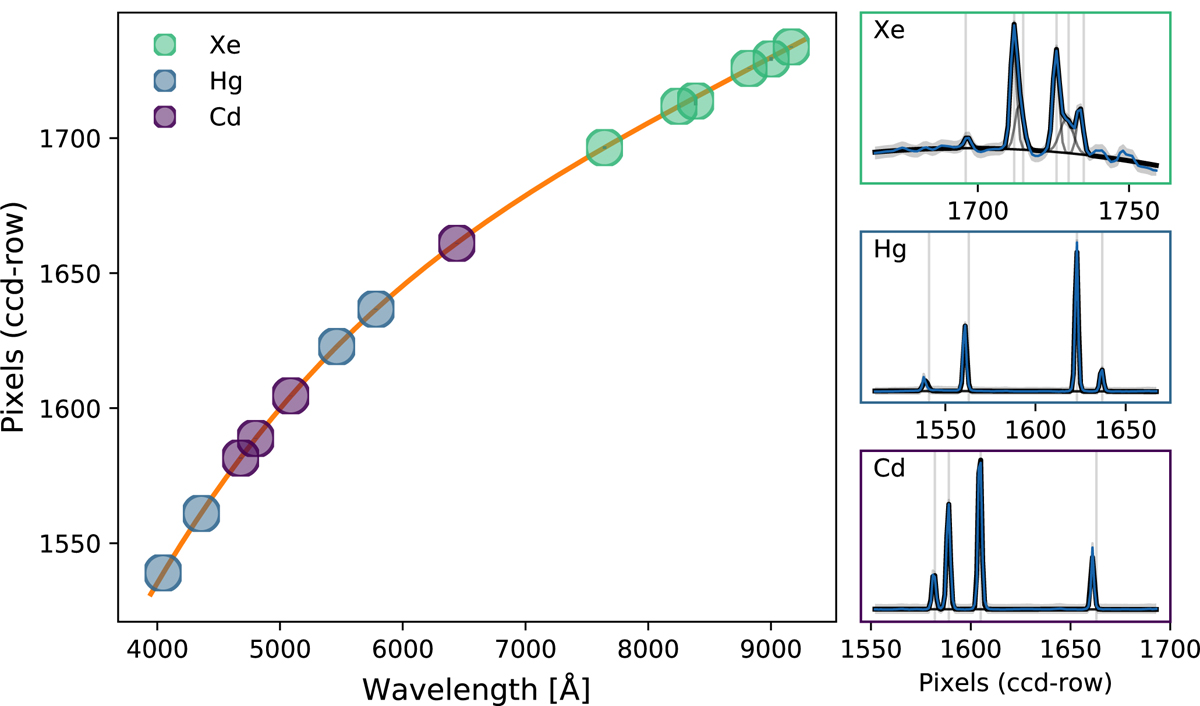
Wavelength solution fit for spaxel #501. Left: fitted centroids of Hg, Cd and Xe (see legend) arc lamp emission lines (in pixel-row from the right) as a function of their expected wavelengths. The orange line is the best fitted fifth order polynomial enabling the conversion of wavelength to pixel and conversely. Right: blue curves represent the arc lamp spectra (in flux per pixel-row from the right). The black lines are the best fitted “Gaussians + third-order polynomial-continuum”. Vertical thin gray lines are the initial guess positions. See details in Sect. 2.1.2.
Current usage metrics show cumulative count of Article Views (full-text article views including HTML views, PDF and ePub downloads, according to the available data) and Abstracts Views on Vision4Press platform.
Data correspond to usage on the plateform after 2015. The current usage metrics is available 48-96 hours after online publication and is updated daily on week days.
Initial download of the metrics may take a while.