Fig. 2.
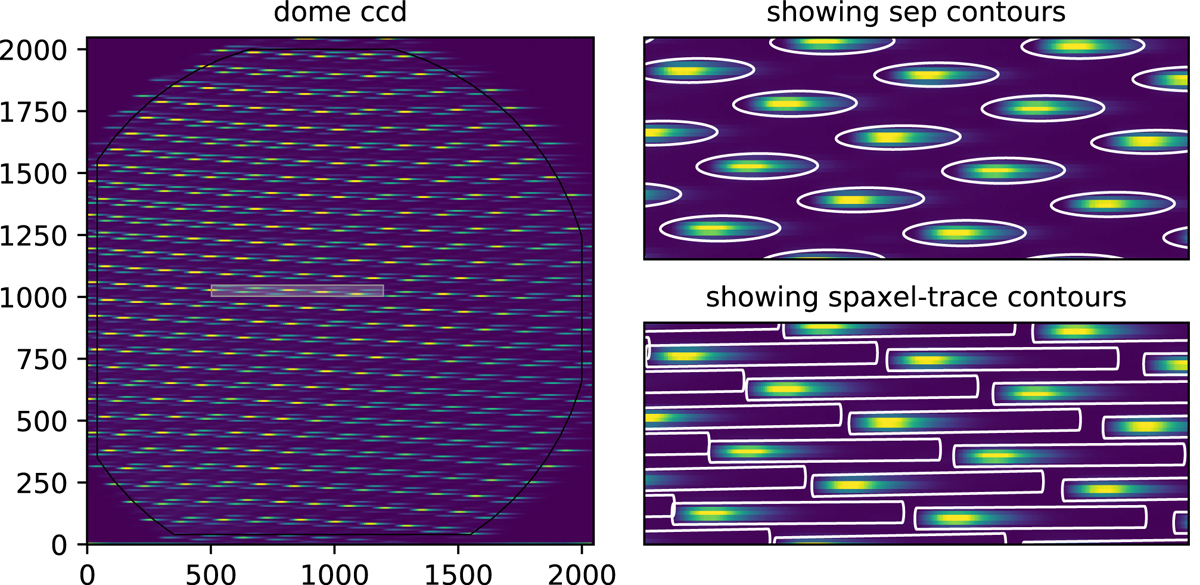
Extracting the trace contours from a SEDM dome exposure. Left CCD image of a dome exposure. The gray rectangle shows the zoom area displayed on the right. Upper right: sep ellipses overplotted on the CCD dome image. Lower right: spaxel-trace contours overplotted on the CCD dome image. For the SEDM, spaxel-trace contours are defined as tilted rectangles. The rotation angle of the centroid position are derived from the sep ellipses.
Current usage metrics show cumulative count of Article Views (full-text article views including HTML views, PDF and ePub downloads, according to the available data) and Abstracts Views on Vision4Press platform.
Data correspond to usage on the plateform after 2015. The current usage metrics is available 48-96 hours after online publication and is updated daily on week days.
Initial download of the metrics may take a while.