Fig. 15.
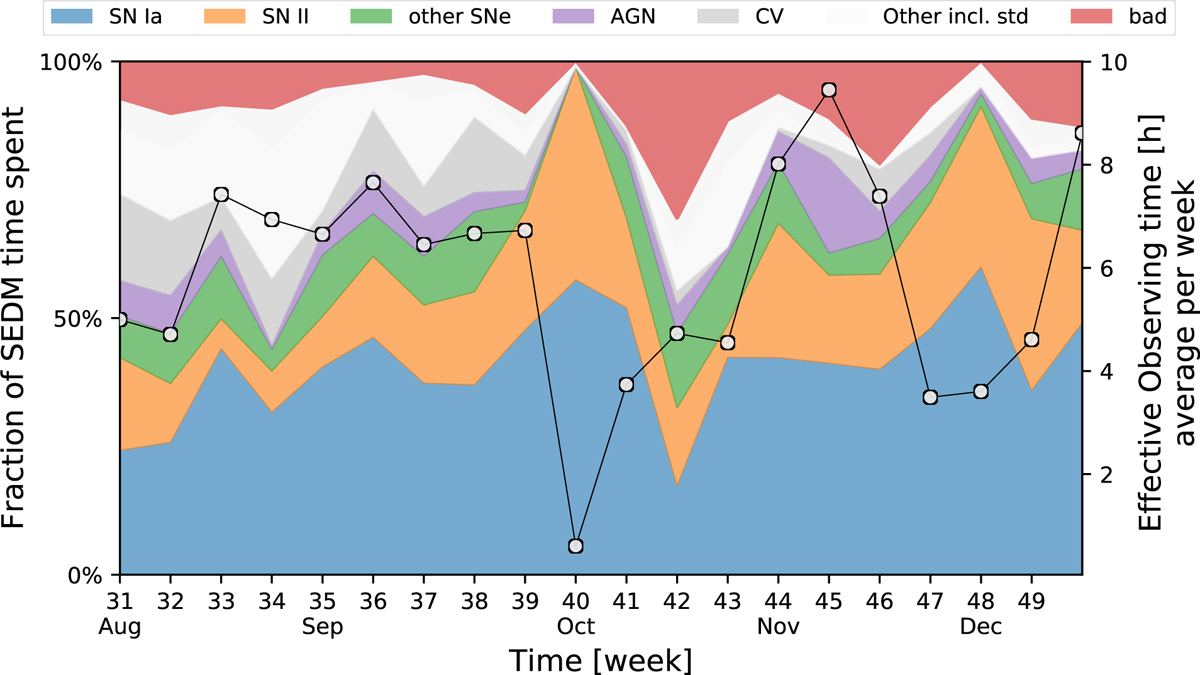
Use of the SEDM time since pysedm is the sole SEDM pipeline (early august 2018) and until redaction of this paper (19 weeks). Color bands show the fraction of target observed per week sorted by type (see legend): left axis. The running line with gray markers shows the evolution of the effective time spent on target per night (weekly average): right axis.
Current usage metrics show cumulative count of Article Views (full-text article views including HTML views, PDF and ePub downloads, according to the available data) and Abstracts Views on Vision4Press platform.
Data correspond to usage on the plateform after 2015. The current usage metrics is available 48-96 hours after online publication and is updated daily on week days.
Initial download of the metrics may take a while.