Open Access
Fig. 14.
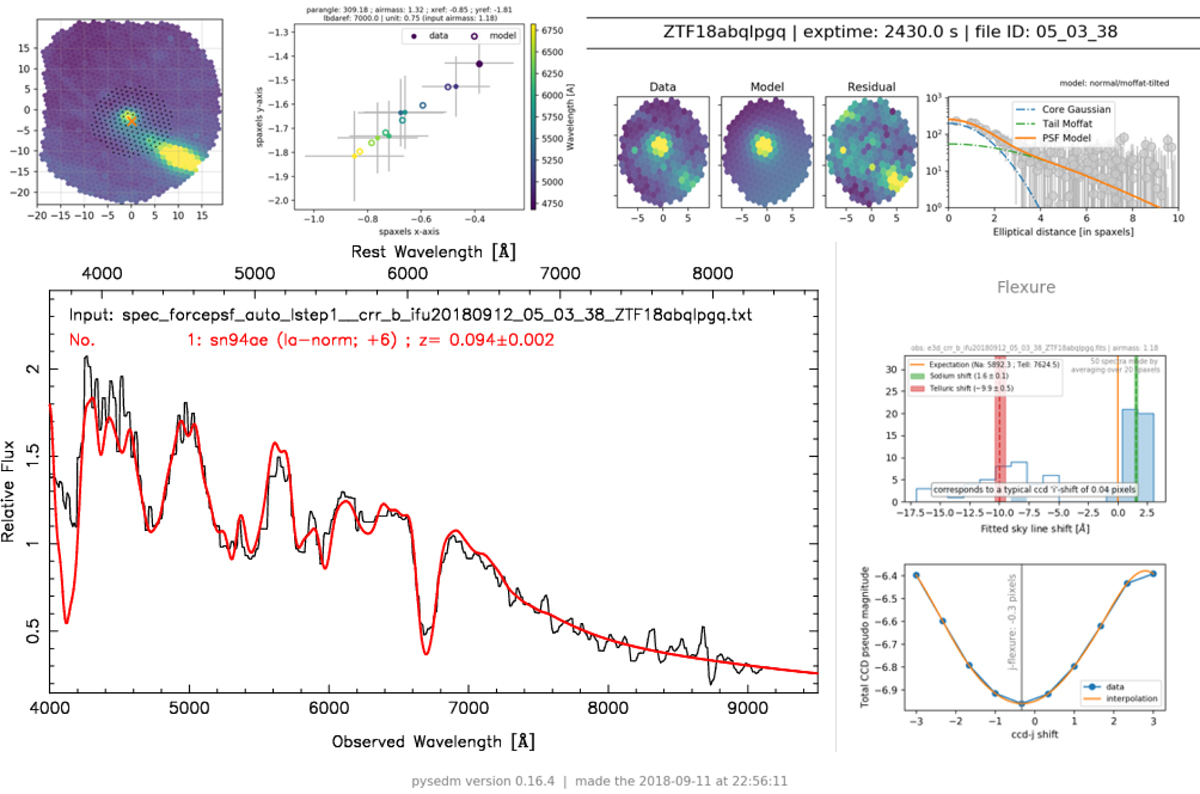
Summary figure presenting in one compact image the relevant plot automatically generated by the pysedm pipeline. The figure is automatically created and pushed together with the final flux-calibrated spectrum to registered clients, notably the ZTF marshal. This example is a science observation of ZTF18abqlpgq.
Current usage metrics show cumulative count of Article Views (full-text article views including HTML views, PDF and ePub downloads, according to the available data) and Abstracts Views on Vision4Press platform.
Data correspond to usage on the plateform after 2015. The current usage metrics is available 48-96 hours after online publication and is updated daily on week days.
Initial download of the metrics may take a while.