Fig. 13.
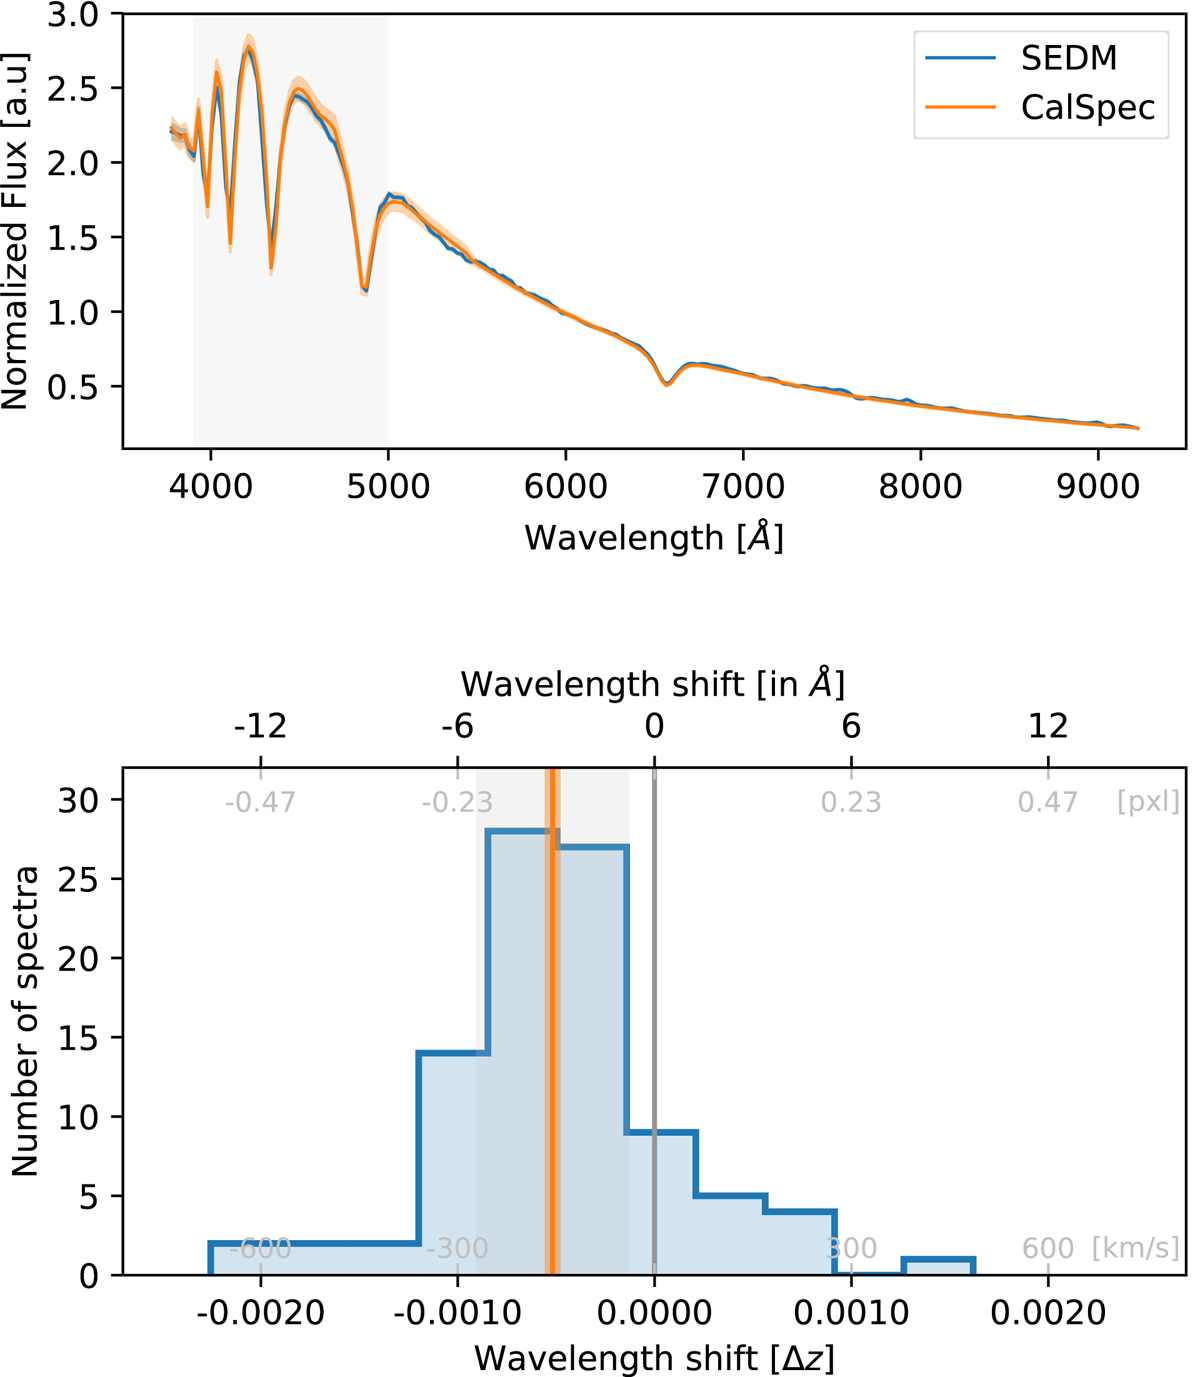
Accuracy of the wavelength calibration. Top: SEDM and a CalSpec spectrum of the HZ4 standard stars. The gray band shows the wavelength region used to fit for the wavelength shift between the two spectra. Bottom: histogram of the wavelength shift fitted on the 94 HZ4 star spectra obtained by SEDM in September 2018. The lower axis presents the shift in redshift shift (in z or in km s−1), the upper axis shows the corresponding offset in Å or pixel for a typical wavelength of 6000 Å. The vertical orange line represents the mean and error on the mean. The light-gray band shows the standard deviation. SEDM spectra automatically extracted by pysedm have a precision of ∼3 Å or 4 × 10⁻⁴ in redshift. A small 1 s.d. offset is visible suggesting that the SEDM spectra a lightly blue-shifted of approximately a tens of a pixel. The origin of this shift is under investigation.
Current usage metrics show cumulative count of Article Views (full-text article views including HTML views, PDF and ePub downloads, according to the available data) and Abstracts Views on Vision4Press platform.
Data correspond to usage on the plateform after 2015. The current usage metrics is available 48-96 hours after online publication and is updated daily on week days.
Initial download of the metrics may take a while.