Fig. 12.
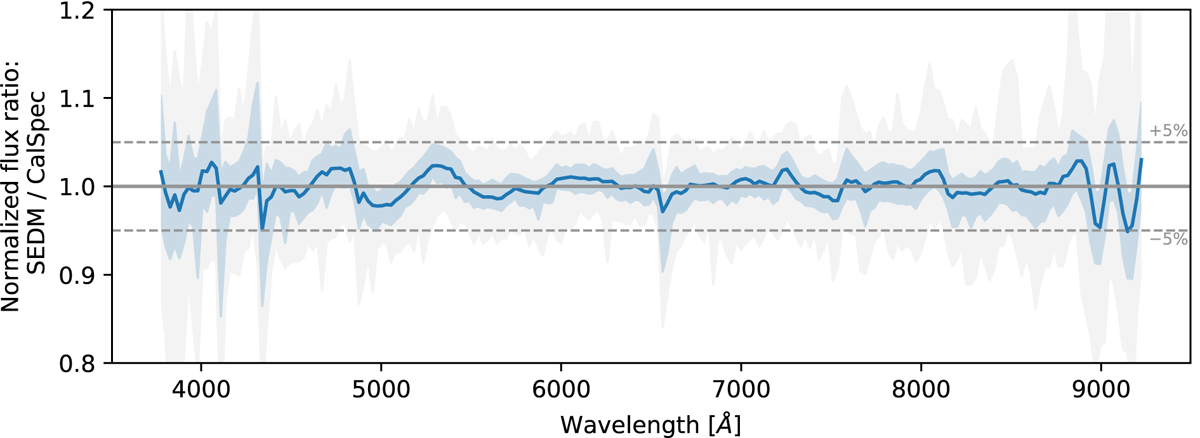
Mean-normalized ratio between flux-calibrated standard star spectra (considered as science targets, various stars have been used) and their expected CalSpec spectra. The solid blue line shows the running median spectrum value, while the blue and gray bands encapsulate 68% and 95% of the spectra, respectively. This figure illustrates that our color calibration is accurate at the few percent level.
Current usage metrics show cumulative count of Article Views (full-text article views including HTML views, PDF and ePub downloads, according to the available data) and Abstracts Views on Vision4Press platform.
Data correspond to usage on the plateform after 2015. The current usage metrics is available 48-96 hours after online publication and is updated daily on week days.
Initial download of the metrics may take a while.