Fig. 11.
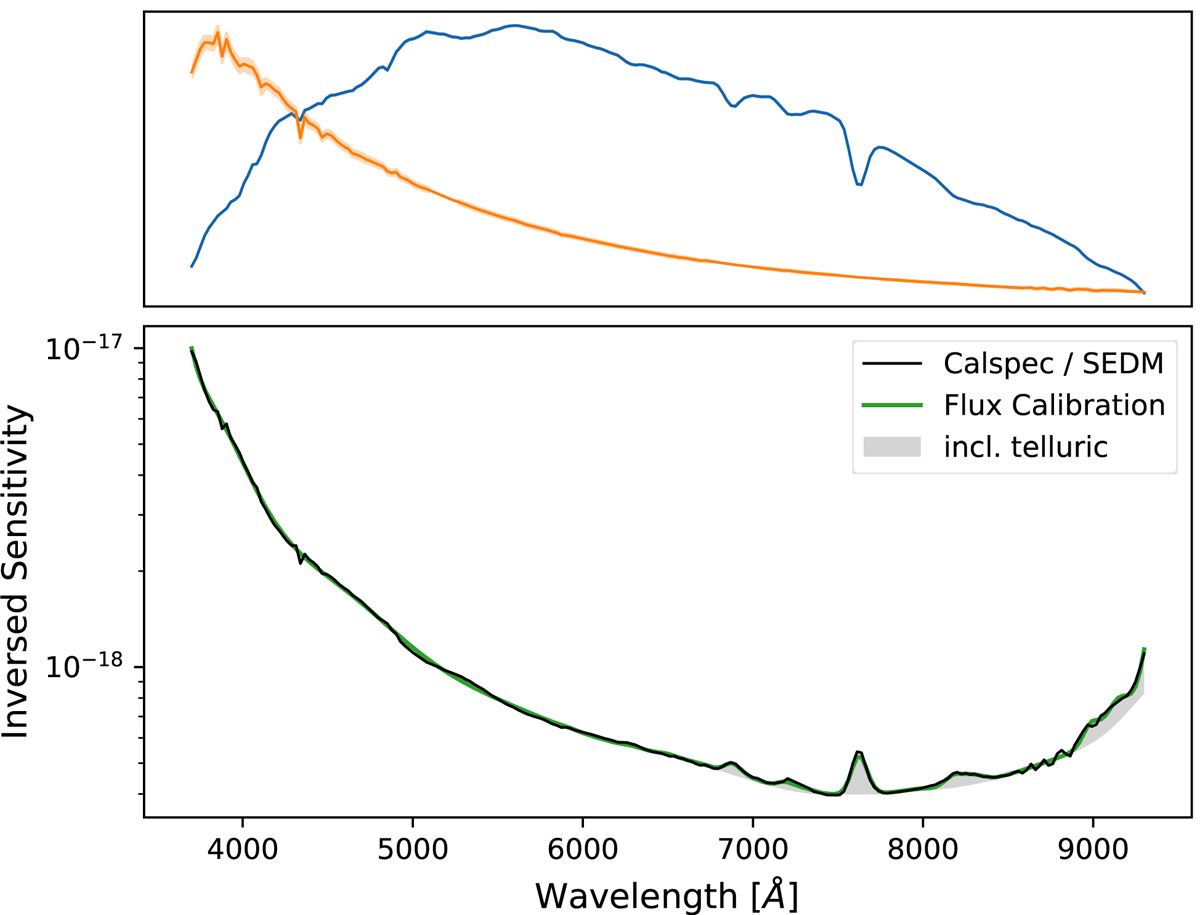
Illustration of the flux calibration procedure. Top: in blue, extracted standard star spectrum in pseudo-ADU of BD+33d2642; in orange, flux-calibrated CalSpec spectrum of the same star convolved at the SEDM wavelength resolution used as flux reference. Bottom: in black, ratio between CalSpec and SEDM spectra (top). The green curve is the full flux calibration model (continuum+telluric). The influence of the telluric correction is shown as a gray shaded area; hence the lower of the gray area represents the continuum component of the flux calibration. When flux-calibrating a science target, the intensity of the telluric component (in gray) varies to match that expected at the science target air-mass.
Current usage metrics show cumulative count of Article Views (full-text article views including HTML views, PDF and ePub downloads, according to the available data) and Abstracts Views on Vision4Press platform.
Data correspond to usage on the plateform after 2015. The current usage metrics is available 48-96 hours after online publication and is updated daily on week days.
Initial download of the metrics may take a while.