| Issue |
A&A
Volume 627, July 2019
|
|
|---|---|---|
| Article Number | A167 | |
| Number of page(s) | 16 | |
| Section | Celestial mechanics and astrometry | |
| DOI | https://doi.org/10.1051/0004-6361/201935319 | |
| Published online | 18 July 2019 | |
Spectral characterization of newly detected young substellar binaries with SINFONI
1
Department of Astronomy, Stockholm University, Stockholm, Sweden
e-mail: This email address is being protected from spambots. You need JavaScript enabled to view it.
2
Sterrewacht Leiden, PO Box 9513, 2300 RA
Leiden, The Netherlands
3
University of Vienna, Department of Astrophysics, Türkenschanzstr. 17 (Sternwarte), 1180 Vienna, Austria
Received:
20
February
2019
Accepted:
13
June
2019
Abstract
We observe 14 young low-mass substellar objects using the VLT/SINFONI integral field spectrograph with laser guide star adaptive optics to detect and characterize three candidate binary systems. All three binary candidates show strong signs of youth, with two of them likely belonging to young moving groups. Together with the adopted young-moving-group ages we employ isochrones from the BT-Settle CIFIST substellar evolutionary models to estimate individual masses for the binary components. We find 2MASS J15104786–2818174 to be part of the ≈30−50 Myr Argus moving group and to be composed of a 34−48 MJup primary brown dwarf with spectral type M9γ and a fainter 15−22 MJup companion, separated by ≈100 mas. 2MASS J22025794–5605087 is identified as an almost equal-mass binary in the AB Dor moving group, with a projected separation of ≈60 mas. Both components share spectral type M9γ/β, which with the adopted age of 120−200 Myr yields masses in the range of 50−68 MJup for each component individually. The observations of 2MASS J15474719–2423493 are of lower quality and we obtain no spectral characterization for the target, but resolve two components separated by ≈170 mas which with the predicted young field age of 30−50 Myr yields individual masses below 20 MJup. Out of the three candidate binary systems, 2MASS J22025794–5605087 has unambiguous spectroscopic signs of being a bona-fide binary, while the other two will require second-epoch confirmation. The small projected separations between the binary components correspond to physical separations of ≈4−7 AU, meaning that astrometric monitoring of just a few years would be adequate to generate constrained orbital fits and dynamical masses for the systems. In combination with their young ages, these binaries will prove to be excellent benchmarks for calibrating substellar evolutionary models down to a very low-mass regime.
Key words: astrometry / brown dwarfs / binaries: close
© ESO 2019
1. Introduction
Multiplicity studies of stars and substellar objects have revealed evidence for a decreasing binary frequency as a function of spectral type. Substellar binaries are thus relatively rare compared to their more massive stellar counterparts, with more than 70% of massive stars of B and A-type being found in binary systems or as part of higher hierarchical systems (Kouwenhoven et al. 2007; Peter et al. 2012). Massive young stellar objects also seem to have higher binary fraction compared to T Tauri and main sequence O-type stars (Pomohaci et al. 2019), suggesting that age and evolutionary stage affect multiplicity rates. For Solar-type stars the binary frequency decreases to ≈50% (Duquennoy & Mayor 1991; Raghavan et al. 2010) and decreases even further to ≈40% for M-stars (Fischer & Marcy 1992; Delfosse et al. 2004; Janson et al. 2012). For later M-types, stretching down to early L-types and into the substellar regime, the binary fraction decreases to ≈15% (Close et al. 2003). Due to the smaller sample sizes, the binary rate for the substellar population is much less constrained, with varying binary frequencies ranging 10−20% for old brown dwarfs (BDs) of ages of 1–10 Gyr in the field (Bouy et al. 2003; Burgasser et al. 2006). Highlighting the trend of decreasing binary fraction with later spectra type, Fontanive et al. (2018) report a binary frequency of ≈5% for field BDs of spectral types T5-Y0 at separations of 1.5–1000 AU. Along with the trend of decreasing binary frequency with decreasing primary mass, which appears persistent throughout both the stellar and substellar mass-regimes, the semi-major axis distribution also decreases to smaller separations for smaller primary mass (Kraus & Hillenbrand 2012; Duchêne & Kraus 2013). Additionally, the mass ratio distribution is shifted towards unity, with higher mass ratios q ≡ M2/M1 for lower-primary-mass binaries (Burgasser et al. 2007), implying the binary population in the substellar regime to be more compact and symmetric compared to earlier types.
Statistics for multiplicity in the substellar regime remain poorly constrained however, as large suitable samples to study have been lacking until recent years. Large sky surveys like the 2 Micron All Sky Survey (2MASS; Skrutskie et al. 2006), Wide-field Infrared Survey Explorer (WISE; Wright et al. 2010), and the Panoramic Survey Telescope And Rapid Response System1 (Pan-STARRS) have increased the number of known substellar objects substantially. As such, several substellar binaries in the Galactic field have been identified; many being old, cool, and of very late spectral type (e.g., Gelino et al. 2011; Dupuy et al. 2015; Huélamo et al. 2015). Efforts have also been put into constraining young stellar associations and young moving groups (YMGs; e.g., Malo et al. 2013; Gagné et al. 2014), creating the possibility to identify young substellar objects and BD binaries such as 2MASS J1207334–393254 (Chauvin et al. 2004) and 2MASS J11193254–1137466 (Best et al. 2017). Trends found in multiplicity studies over both a younger and an older population such as frequencies, semi-major axis distribution, and mass-ratio distributions can thus be used to inform theories about the formation and evolution of BDs (e.g., Marleau & Cumming 2014). However, some formation scenarios for BDs such as the ejection scenario (Reipurth & Clarke 2001), turbulent fragmentation (Padoan & Nordlund 2004), and binary disruption (Goodwin & Whitworth 2007) only predict for tight binaries on separations smaller than ≈10 AU to survive to old field ages, suggesting that wide BD binaries such as WISE J1217+1626 and WISE J1711+3500 (Liu et al. 2012) may form in an alternative formation channel.
Substellar objects with constrained ages have also lately become important in the exoplanet aspect, as low-mass BDs have many characteristics analogous to directly imaged exoplanets such as atmospheres and some formation scenarios. Most detected BD binaries have been of nearby sources (e.g., Luhman 16 AB, ≈2 pc; Luhman 2013), with many being old and cool BDs in the field (e.g., WISE J014656.66+423410.0; Dupuy et al. 2015). As YMGs and associations are being increasingly well defined, we are starting to discover more young BD binaries, including those within the planetary mass regime (e.g., 2MASS J11193254–1137466; Best et al. 2017). Finding these low-mass BDs in YMGs and on tight orbits allows dynamical masses of the systems to be constrained within just a few years of monitoring, which can be compared to and calibrate evolutionary models. The importance of obtaining suitable benchmark substellar objects has been highly advocated, as discrepancies are systematically seen when comparing luminosity-derived masses from models to dynamical masses (e.g., Dupuy et al. 2014). Inconsistencies are also frequently visible when comparing isochrone ages of substellar and low-mass companions to earlier type stellar primaries (e.g., Calissendorff & Janson 2018; Asensio-Torres et al. 2019).
In this paper we present a search for companions to young BDs at the very bottom end of the substellar mass-regime, near the classical Deuterium burning limit at around M = 13−17 MJup (e.g., Spiegel et al. 2011), in order to identify potential touchstone systems to test against formation and evolutionary models. The small sample of objects observed in the study makes it difficult to constrain the multiplicity frequency for young low-mass BDs, but we discover some systems of interest for which multiplicity studies may be expanded upon. We describe the observations including the sample selection and reduction in Sect. 2.2. We perform a spectral analysis of our targets and present our findings in Sect. 3. A more detailed description of the observed targets is shown in Sect. 3.4 for the binaries and in Sect. 3.5 for the unresolved and single sources, and an astrometric solution of the detected binaries is provided in Table 2. We summarize our results and discuss them in Sect. 4.
2. Method
2.1. Sample selection
The observed sample consists of 14 sources out of a larger list of 22 low-mass BDs obtained from the BANYAN survey (Gagné et al. 2015), where we put constraints on the targets in terms of estimated mass and age. We also include the additional constraint of only choosing sources that have nearby bright enough tip-tilt stars so that they can be observed with laser-guide assisted adaptive optics (AO). The targets are identified as low-mass objects with some indications of youth; either by having low surface gravity, or high membership probability of being part of a YMG. We estimate from the YMGs that the targets have ages ranging 12–200 Myr, depending on specific group membership, and are all located within 70 pc of the Sun. Full names of the observed targets and YMG membership status are given in Table 1, where names are otherwise abbreviated from the full 2MASS identifier to the form 2Mhhmm.
Log of VLT/SINFONI observations.
2.2. Observations
Observations were based on the European Southern Observatory 0101.C-0237(A) program and carried out through May to September in 2018 in Service mode at the Very Large Telescope (VLT) at Cerro Paranal, Chile. The instrument used for the observations was the Spectrograph for INtegral Field Observations in the Near Infrared (SINFONI; Bonnet et al. 2004; Eisenhauer et al. 2003), where all observations were carried out with the H + K grating and 1500 spectral resolution power. The AO is required in order to resolve companions on small separations to our targets. Due to the faint nature of the targets, the observations employed the Laser Guide Star (LGS) facility that was available for SINFONI at the time of the observations (SINFONI has since been removed from the telescope and placed on another unit telescope without LGS). Tip-tilt stars were obtained for all targets in order to optimise the LGS-AO observations. Each target was observed with an exposure time of 300 s that was repeated six times with a small dithering pattern used to correct for sky and bad pixels. The procedure of the data reduction is described in Sect. 2.3.
The program observed 14 targets in total. However, due to difficulties in acquisition for such faint sources under modest or poor conditions, only eight of the observations showed clear signs of the target sources, with six of them being of sufficiently good quality that spectra could be extracted from the data. For one of the two poor-quality cases, 2MASS J15474719–2423493 (hereafter 2M1547), we find that the source is a tentative planetary-mass binary that will require follow-up observations for confirmation. In the other poor-quality case, 2MASS J18082129–0459401 (hereafter 2M1808), the source is only seen in two of the six frames, with the object being very close to the edge of the detector, meaning that potential companions outside would go undetected. We therefore exclude 2M1808 completely from our analysis. For the six high-quality sources we find two to be good substellar binary candidates. The observations and the status of the sources are listed in Table 1, also showing the YMGs affiliated with the respective sources.
2.3. Data reduction
Raw data are reduced using the ESO reduction pipeline, Esoreflex (Freudling et al. 2013), where raw images are converted to full data cubes. We note that there is a drift in x and y positions for different wavelengths within the cube, where the peak value of the sources changes from the shortest wavelength slice to the longest wavelength, likely caused by atmospheric dispersion. We solve the issue with the drift by applying a development-level version of the pipeline which corrects for the atmospheric dispersion. The full data cubes are then collapsed and investigated by eye to identify potential companions. For detected potential binary candidates we employ an iterative PSF fitting method to account for partially overlapping PSFs of the closely separated binaries. The procedure is similar to the scheme developed for the AstraLux M-dwarf multiplicity survey (Janson et al. 2012, 2014), also described in Calissendorff et al. (2017). Concisely, the scheme takes a rough initial estimation for the location in x and y pixels along with a prediction of the brightnesses of the two components in the binary. Subsequently, we build a model system using two copies of a PSF reference, typically the standard stars observed close in time to the observations of the target. The brightnesses and positions of the two components are then varied iteratively, and subtracted from the observed data until a minimum residual solution is found. The procedure is illustrated in Fig. 1 for the target 2M2202 which serves as an example. The usage of several different standard stars as PSF provides us with some statistical variations of the astrometric positions, letting us evaluate errors resulting from imperfections from the PSF matching. As the PSF fitting procedure yields differential coordinates Δx and Δy in pixels, we convert the output into sky coordinates using the plate scale from the SINFONI user manual2 of px = 12.5 mas and py = 25 mas. The PSF fitting procedure is performed on each individual wavelength-slice within the data cube. We vary the PSF reference for each binary candidate and keep the median astrometric value of each wavelength slice, with the standard deviation as uncertainty. We then again take the median of the astrometry for the entire wavelength range as our final result, presented in Table 2, where we combine the statistical errors from the median wavelength range and the uncertainty in individual wavelength slices.
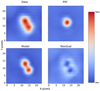 |
Fig. 1. PSF-matching for the binary 2M2202. Upper left and right plots: observed data and PSF of the standard star used, respectively. Lower left plot: best fit of a constructed model made from two reference PSFs that we match to the positions and scale with the brightness of the two components. Lower right plot: residuals after subtracting the model from the observed data. All plots have been normalized to match the observed data. |
Compiled results for the observed targets including photometry and astrometry for the binary candidates.
All targets are handled in the same way with the exception of 2M1547, where the observations are of poor quality and the source appears much fainter than expected, and therefore we obtain an ambiguous detection of the source. The observations of 2M1547 also lack proper sky subtraction due to the small dithering pattern employed, causing self-subtraction of the source signal when attempting to coadd frames. Therefore, we reduce the frames with the pipeline using no in-built sky subtraction and perform custom post-subtraction using empty sky frames obtained directly before and after the observations of 2M1547. The resulting collapsed data cubes for each detected binary candidate are shown in Fig. 2 together with their respective point spread calibrator reference.
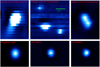 |
Fig. 2. Upper images: collapsed data cubes of all observed frames for the detected binary candidates; 2M1510 (left), 2M1547 (middle), and 2M2022 (right). Lower images: corresponding relevant point source reference used in the fitting procedure of the astrometric measurements. Special care is taken for 2M1510 where we find no suitable standard reference star to match the PSF of the BD binary components, and thus an unresolved 2D Gaussian function is fitted to the entire system which is further explained in Sect. 3.4.1. For 2M1547 we note a third point source in the upper left part of the image which we do not include in our analysis since it was weak and appeared artefact-like in our original data reduction that did not correct for atmospheric dispersion. Derived astrometric parameters and photometry for each individual object are seen in Table 2. The scaling in each individual image is chosen to better highlight the individual components. North is up and east is to the left in the figures. |
3. Results
3.1. Color-magnitude diagrams
The PSF matching algorithm employed also provides us with information on the relative brightness of each component in the matching, which is then used to calculate the magnitude of the individual components. We choose a subset of wavelength slices within the data cubes which we use to construct a custom H′ magnitude between wavelengths of 1.5 and 1.8 μm and a custom K′ magnitude with wavelengths ranging 2.1−2.45 μm. We calculate the apparent magnitude in H′ and K′ band separately using the unresolved apparent magnitudes from the 2MASS catalog (Skrutskie et al. 2006) of each system and scaling the brightness with respect to the relative brightness of the components acquired from the PSF matching, before adding up the total flux for each band and comparing it to literature 2MASS fluxes. The PSF-matching routine is performed several times, varying the reference PSF in order to obtain a statistical measurement for the relative brightnesses. We produce a median relative brightness for each individual wavelength slice, and keep the standard deviation as the uncertainty, which is then propagated together with the formal 2MASS unresolved magnitude errors to estimate the uncertainty in our derived magnitudes. The resulting apparent magnitudes are shown in Table 2, where we use Gaia DR2 parallaxes to calculate distances and absolute magnitudes.
Color-magnitude diagrams (CMDs) can provide insight into youth and spectral types of these kinds of substellar objects. In Fig. 3 we place our targets in a CMD and compare them to similar objects found in the literature, including low-mass stars and known BDs from Dupuy & Liu (2012) as well as BDs with low gravity and field BDs from the BANYAN survey (Gagné et al. 2015). Most of our observed targets, both single and binaries, show signs of low surface gravity and are considered young as seen in the diagram, with the exception of 2M2117 which is of a later spectral type (∼T0) compared to the other objects in our target sample, where most are between M9 and L1 spectral types.
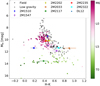 |
Fig. 3. Color-magnitude diagram showing our observed targets together with known substellar objects from the literature. The blue, magenta, and yellow markers show the binary candidates 2M1510, 2M1547, and 2M2202, respectively, where the primaries are illustrated by the diamonds and the squares represent the secondary binary components. Unresolved and single sources in our survey are shown by circles only. We include low-mass stars and BDs from Dupuy & Liu (2012) as smaller circles, which have been color coded on a spectrum shown by the color bar in the figure, going from late M type to early T type. We only include objects from the list that have known spectral type and Gaia parallaxes. The gray triangles show low-mass objects from the BANYAN survey (Gagné et al. 2015), where the downward-pointing triangles show field dwarfs, and the upward-pointing triangles show objects with low surface gravity and strong signs of youth. Photometry is based on 2MASS bands for all sources. Most of our sources seem to be on the redder side in the diagram, suggesting some extinction by being dusty, which could be considered as a sign of youth. |
3.2. Spectral analysis
We obtain unresolved spectra for each of our targets by fitting circular apertures to the target source, where the radii of the apertures are determined by first matching a 2D Gaussian to the wavelength-collapsed cube, separately for the H′ and K′ bands. The same is done for the standard stars obtained for each target, which is then used to flux-calibrate the source spectra. In order to obtain resolved spectra for the detected binaries we scale the unresolved spectra for each component by their relative brightness obtained from the PSF-matching described in Sect. 2.3, where the standard deviation for the relative brightness in each wavelength slice is adopted as the uncertainty for each respective spectral element. The resolving power of SINFONI with the H + K-band is R = 1500, corresponding to a spectral resolution of Δλ = 5 Å.
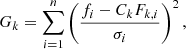
To match model spectra with the observed flux from our target sources we adopt the same approach as Cushing et al. (2008), and scale the models to match the observations and estimate a goodness-of-fit value for each model. The data are then compared to the modeled spectral energy distribution, where the goodness-of-fit statistic Gk for each model k is defined by
 (1)
(1)
with n being the number of data pixels, i the index of the wavelength, fi the observed flux, Fi the modeled flux, σi the uncertainty, and Ck the scaling constant used. We calculate the scaling constant Ck for each spectral band H′ and K′ separately as
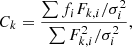 (2)
(2)
and select the best-fitting models by locating the minimum G-values for three cases of H′-band only, K′-band only, and H′+K′ bands together, ignoring the wavelength-range between the bands at around ≈1.8−2.1 μm. Because the wavelength dispersion is constant in both bands for SINFONI, we ignore the weight of the wavelength used in the original equation. We perform the spectral analysis for each target and component by matching the observed spectra with empirical templates to obtain the spectral type, as well as comparing the observed spectra to theoretical spectra from the BT-Settl CIFIST (Baraffe et al. 2015) evolutionary models, described further in the following sections.
3.2.1. Empirical templates
We create empirical templates of spectral types by combining and taking the median of several already known BD spectra from the literature. We adopt the same spectral indices as introduced by Kirkpatrick et al. (2006), which signify low surface-gravity and youth (i.e., α ∼ 1000 Myr, β ∼ 100 Myr, γ ∼ 10 Myr, δ ∼ 1 Myr). We gather most of the empirical objects from the Montreal spectral library3 (Gagné et al. 2015; Robert et al. 2016), and produce our composite templates from the median of the sources available for a given spectral type and surface-gravity index, selecting only the empirical sources which share the same spectral resolution for a given spectral type. The empirical sources are first interpolated to have matching wavelengths before taking the median values to construct the composite templates, with resolutions varying in the range Δλ ≈ 5−40 Å from best to worst. The composite spectral templates are shown in Fig. 4. For the later spectral types such as T-type dwarfs we do not procure surface-gravity indices, and instead form our median template model spectra from known T-types from the SpeX Prism Library (Burgasser 2014) and the Sloan Digital Sky Survey (Chiu et al. 2006).
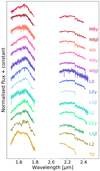 |
Fig. 4. Examples of the composite spectral templates produced from the median of several empirical spectra from the literature. The composite templates for late M and early spectral types with surface gravity indices γ and β are constructed by taking the median of several objects from the Montreal spectral library (Gagné et al. 2015; Robert et al. 2016). For T-types we construct median template spectra from known T-types in the SpeX Prism Library (Burgasser 2014) and the Sloan Digital Sky Survey (Chiu et al. 2006). The templates have typical resolution of Δλ ≈ 5−40 Å. |
Spectra from our observed sources are smoothed to match the resolution of the templates and subsequently interpolated to match the template wavelengths. For the objects identified as unresolved sources or single BDs in our survey we find good matches to their previously indicated spectral types from the BANYAN survey (Gagné et al. 2015). We show the best-fit templates to the observed spectra in Fig. 5, where the fluxes have been normalized and scaled with a constant to fit the plot. For the binary candidates we were only able to obtain sufficiently good spectra for 2M1510 and 2M2202 to make a spectral analysis. We use the same spectral type model templates as with the other sources, but scale the observed flux for the binaries according to their relative brightness. Due to the very small relative separations between the binary components in both cases, it is likely that the spectra of the companions will contain contaminations from their respective primary component. For 2M2202 this contribution is likely to be small, as the relative brightness is close to unity and we expect the spectral types to be the same. However, for 2M1510 the contamination is more prominent, and we obtain some degeneracies when matching the spectral type for the fainter companion. We estimate the uncertainty of the empirical fits as the range of templates with a goodness of fit within  of the best-fit value, typically corresponding ±1 spectral type for a given source.
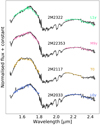 |
Fig. 5. Empirical spectral templates fitted to the unresolved single sources with no detected companions. The spectra are smoothed to match the resolution of the templates, and then scaled and fitted according to Eq. (1). |
3.2.2. Theoretical models
We compare the observed spectra to the theoretical BT-Settl CIFIST models from Baraffe et al. (2015), where we convolve the spectral models to the width of the observed spectra and interpolate the wavelength steps to match the observations. For the theoretical model fits of the single or unresolved sources, we bin the observed data beforehand to a wavelength resolution of Δλ = 25 Å, adding the standard deviation of the mean of the bins to the uncertainty. We make use of the models that assume solar metallicity and have temperatures ranging 1200−2900 K and surface gravities in the range logg = 3.5−5.0, matching the theoretical spectra to the observations, and estimate a goodness-of-fit value for each model. We note that there are several degeneracies within the models, where alternating between temperatures and surface gravities sometimes yields similar goodness-of-fit values. We plot the resulting best-fit models together with the observed spectra for each single-system source together with a grid map showing the goodness of fit for each model in Figs. 11–14. The black dot in the grid maps represents the best-fit models, and the contours depict the 68%, 95%, and 99% confidence intervals calculated as ΔGk = 2.3, 6.18, and 11.83 respectively.
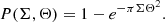
3.3. Chance projections
Considering the very small field of view employed by SINFONI of 0.8″ × 0.8″, it is already unlikely that our detected binaries are contaminated by background sources. However, in order to make a statistical argument about the binary components being gravitationally bound we calculate the probability of chance projection for background sources to our systems, applying the same procedure as described in Correia et al. (2006) and Lafrenière et al. (2014). For this purpose we make use of the 2MASS Point Source Catalog4 (PSC) and probe a larger field with a radius of 15′ around each of our targets, and calculate a cumulative distribution of sources brighter in H′-band magnitude than the companion binary for each target, illustrated in Fig. 6. By assuming that unrelated objects across the field are uniformly randomly distributed we obtain the average surface density of brighter objects, Σ (H < H′companion). The probability of having at least one unrelated source within a specific angular separation, Θ, from a target of interest is then estimated by
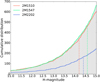 |
Fig. 6. Cumulative distribution of 2MASS point sources of different H-band magnitudes in a 15′ radius around our detected binary candidates, represented by the red line for 2M1510, the green line for 2M1547, and the blue line for 2M2202. The dashed lines indicate the secondary component H′-band magnitude for each respective binary and the corresponding cumulative number of point sources that are brighter in the field. The field around 2M2202 is somewhat less dense than that around the other two, and the estimated chance of any of our binary candidates being a background source is on the order of ∼10−5 or smaller. |
Applying the calculations for each of our binary systems yields chance projections with probabilities of 1.2 × 10⁻⁵ for 2M1510, 5.7 × 10⁻⁵ for 2M1547, and 2.4 × 10⁻⁶ for 2M2202. By assuming that all systems share the same source density as the most crowded field, and that all companions share the same brightness and separation as the faintest and most distant companion candidate observed, we can set an upper limit to the probability of observing three chance projections among the seven target sources successfully observed. For a given source the estimated number of background sources is equivalent to the chance projections, which we estimate to be 3.8 × 10⁻⁴. Therefore, assuming a Poisson distribution, the probability of obtaining three chance projections for all seven of the observed sources is near negligible, 9.2 × 10⁻¹².
3.4. Binary candidates
By examining the wavelength-collapsed data cubes from our observations we identify three of our targets as binary candidates, and are also able to obtain resolved spectra for two of them. Assuming that all detected binaries are bona fide systems we can also assume the binary components to have the same age as their respective primary. Using the resolved brightness of the systems we can estimate individual masses by comparing their luminosity to isochrones from theoretical evolutionary models. Here we employ the BT Settl CIFIST 2011–2015 models from Baraffe et al. (2015) for consistency with our spectral analysis. The astrometric data for the resolved binaries and inferred masses for the respective components along their corresponding ages and magnitudes are shown in Table 2, which are plotted in an age–mass diagram in Fig. 7. We combine the errors from our photometry with the age-ranges of the relevant YMGs to obtain the uncertainties on the mass estimated from the isochrones.
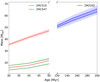 |
Fig. 7. Isochrones showing the theoretical masses inferred from the BT-Settl CIFIST evolutionary models for the binaries presented in this work. The primary and secondary components are depicted by the upper and lower solid lines for each respective source, and the shaded colored areas represent the uncertainty in the mass-estimates from the luminosities. The plot has a discontinuity in the age-range on the x-axis, showing only the ages of relevance for the objects included, and not featuring ages between 50 and 120 Myr. We note that alternative isochrone models may predict other masses for the same ages and luminosities, and our choice of models is based on consistency with the theoretical spectral models employed in our analysis. |
The following sections provide further detailed information on the individual systems classified as binaries in our survey.
3.4.1. 2MASS J15104786–2818174
We identify 2M1510 as a substellar binary from the wavelength collapsed data cube in the leftmost image in Fig. 2. The system has previously been identified as a late M-dwarf of spectral type M9 and a potential member of the Argus moving group with an age of 30−50 Myr (Burgasser et al. 2015; Gagné et al. 2015; Faherty et al. 2016). We note that the Convergence Tool5 developed by Rodriguez et al. (2013) suggests that the system is in the ∼200 Myr-old Carina-Near YMG (Zuckerman et al. 2006) with 100% probability. However, the Argus group is not featured in the Converge Tool, whereas the BANYAN Σ includes both groups, and suggests a 99.2% membership probability for Argus while dismissing Carina-Near completely. We assume the system to be in the Argus group, adopting an age of 30−50 Myr for our subsequent calculations.
Gaia DR2 data yield proper motions of μRA = −118.75 ± 0.49 mas yr−1 and μDec = −46.87 ± 0.42 mas yr−1 along with a system parallax of 27.22 ± 0.27 mas, giving 2M1510 a distance of about 37 pc (Lindegren et al. 2018). The projected separation between the primary and binary component is observed to be 103.43 ± 13.43 mas, translating to a physical separation of ≈4 AU. The uncertainty in the astrometry for 2M1510 is greater than for the other binary candidates due to the lack of adequate PSFs to reproduce the data; most of the uncertainty stems from the K′-band in which the companion is fainter in comparison to at shorter wavelengths. In order to transform the projected separation to a statistical estimate for the semi-major axis we apply the conversation factor of 1.16 for very low-mass visual binaries derived by Dupuy & Liu (2011). We obtain a statistical estimate of the semi-major axis of a ≈ 4.4 AU, which with the third law of Kepler converts to an orbital period of P ≈ 30 years.
We investigate whether the binary candidate companion to 2M1510 could be due to the effect of the PSF by plotting the residual left after subtracting the matched PSF model of only one component at a time, as illustrated in Fig. 8. The model is based on the unresolved system convolved with a 2D Gaussian fit, later scaled to match the brightness of each component and repositioned for the smallest residual as explained in Sect. 2.3. When subtracting the PSF model from the primary, the secondary shows a point-source morphology. Additionally, no similar PSF effect is seen in the reference star observed just after the exposures of 2M1510. Furthermore, the astrometric behavior is not consistent with a diffractive feature; while there is a ∼10% difference in separation between the H′ and K′ band for astrometric measurements in the individual bands, it is much smaller than the ∼40% effect that would be expected for diffractive features. We also scrutinize each separate data cube from the observations, verifying that the fainter source is real and visible in all cubes, and not due to a telescope pointing error where the primary could have been in the wrong position for a small fraction of the integration time.
 |
Fig. 8. Snapshots of the collapsed data cube in the H′+K′-band for the binary candidate 2M1510. (A) Observed data. (B) Model of the data where the PSF has been placed over the primary and secondary positions and scaled to match their relative brightnesses. (C) Residual after subtracting the model primary component from the observed data. (D) Residual after subtracting the model secondary component from the observed data. All snapshots have been normalized to match the observed data, using a different scaling compared to Fig. 2. The fainter component is visible in all of the data cubes obtained from the observations. |
The observed resolved brightness of both components along with predicted masses are shown in Table 2. We estimate the individual masses by comparing the observed luminosities to isochrones from the BT-Settl CIFIST models, interpolating the model luminosities to the observed values and adopting the age of the YMG associated with the system. Doing so yields a primary mass of 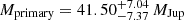 and secondary mass ranging
  , corresponding to a primary-to-secondary-mass ratio of q ≈ 0.45.
We compare the spectra of the binary pair according to the spectral analysis described earlier in Sect. 3.2, using both empirical templates and theoretical models, as displayed in Fig. 9. From the spectral analysis we conclude that the primary, denoted as 2M1510A, is most likely a young M9γ substellar object. The secondary, denoted as 2M1510B, proves more difficult to characterize due to contamination from the primary and we are unable to verify a precise spectral type assignment. Nevertheless, the fainter nature of the companion and the flatter shape in the K′-band implies that it is of later spectral type than the primary. The theoretical model suggests that the primary has an effective temperature of Teff = 2600 ± 100 K and a surface gravity in the range logg = 4.0 ± 0.5. The best-fit models for the companion candidate are very similar to the primary, with Teff = 2600−2700 K and logg = 4.0−5.0, but much of the shape of the spectra is highly contaminated by the primary as seen in the lower plots of Fig. 9 where we compare the two components side to side. The theoretical spectra for the primary are consistent with the effective temperature obtained from the isochrones for the same brightness. For the secondary component, the theoretical spectra predict a much higher temperature than the isochrones, which would place the temperature at Teff ≤ 1800 K. We believe this discrepancy is likely to stem from the high contamination from the primary component.
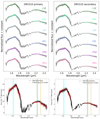 |
Fig. 9. Top row: empirical templates fitted to the spectra of the components to 2M1510, suggesting best fits for M9γ or an earlier type for both components. Due to the contrast and proximity of the companion to the primary, it is very likely that much of the shape of the spectrum of the secondary component is contributed by the primary. The companion is about 0.2 times the brightness of the primary, and it is unlikely they would be of the same spectral type (although this discrepancy may be mitigated if the primary is an unresolved binary). Lower plots: best-fit theoretical evolutionary models from BT-Settl CIFIST to each individual component. We find the best-fit models to be Teff = 2700 K with logg = 3.5 for the primary and Teff = 2700 K with logg = 4.5 for the secondary. The contrast in magnitude between the components is estimated to be ΔMH ≈ 2, and we would expect the secondary component to be cooler than what is predicted by our best-fit model. |
Interestingly, Gizis (2002) note another object in close proximity to the target source, only 5.9 arcsec south and 3.3 arcsec west, 2MASS J15104761–2818234, witha similar spectral type to M8–M9. The close proximity could indicate that the two objects are part of the same system, and more recent Gaia DR2 results show similar trigonometric parallax values for both of the late M-dwarfs, along with proper motions, suggesting that they are indeed likely to be part of the same system. The projected separation of the two objects and the parallax suggest that they have a physical separation of about 250 AU. Furthermore, Triaud et al.6 find through photometric monitoring of the system that one of the components is an eclipsing binary, making this a very interesting system from a hierarchical point of view, with perhaps four substellar components. This scenario could partly explain the discrepancy in temperature for the primary and binary components detected in our observations. It is possible that 2M1510A itself is a close-in multiple system whose combined brightness gives the appearance of an overluminous object with respect to its temperature, similar to other unresolved substellar multiples such as 2M1610-1913 (Lachapelle et al. 2015).
3.4.2. 2MASS J15474719–2423493
This source was previously identified as a low-gravity object with a spectral type of M9β and an age estimate ranging 30−50 Myr, corresponding to a planetary mass of 12.9 ± 0.3 MJup (Gagné et al. 2015). Updated space velocities and parameters from Gaia DR2 with proper motions μRA = −141.12 ± 0.72 mas yr−1, μDec = −132.71 ± 0.46 mas yr−1 and parallax π = 29.20 ± 0.40 mas combined with the updated BANYAN Σ-tool suggests that the system belongs to the field rather than being a YMG. Gagné et al. (2015) evaluate the system as a young field object based on several signs of youth, including a lower-than-normal equivalent width of atomic species in the optical spectrum as well as in the NIR spectrum, triangular-shaped H-band continuum, and redder-than-normal colors for the given spectral type. The Convergence tool suggests a probability of 31.3% for 2M1547 to be in the Columba YMG, which has an estimated age of ≈35 Myr, thus consistent with the other age estimates for the system.
We identify a faint companion to the main source with a projected separation of 173.66 ± 0.50 mas, seen in the middle plot of Fig. 2. Using the conversion factor of 1.16 for converting the physical separation to a statistical estimate of the semi-major axis we obtain a ≈ 7.0 AU, translating into an orbital period of P ≈ 100 years. However, the observations are of poor quality and the signals for either of the components identified are too faint to be seen in individual wavelength-slices, and are only visible when collapsing the data cube. The dithering pattern for the observations of 2M1547 is very small, sometimes less than a pixel, and therefore we cannot obtain good sky subtraction for the observations without self-subtraction of the source. To work around the issue we perform the reduction scheme with the SINFONI pipeline without any sky subtraction, and post process each individual reduced frame by subtracting sky frames from observations taken immediately before and after the observations of 2M1547. The improvement is small, but allows us to identify the companion candidate with higher signal-to-noise ratio than using no sky subtraction at all.
We perform our astrometric analysis on the reduced and post-processed collapsed frames, obtaining projected separations, positional angles, and relative brightness between the components. We estimate the secondary source in the field to be ≈0.55 times the brightness of the primary source in the H′-band. For the K′-band we obtain similar brightness for both components, which is likely due to the poor quality of the observations and weak signal for both sources in the K′-band. As with the other binaries, we estimate the individual component masses using the BT-Settl-CIFIST evolutionary models of Baraffe et al. (2015). For 2M1547 we obtain a primary mass of 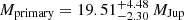 and secondary mass of
  for the adopted young field age of 30−50 Myr, corresponding to a mass ratio of q = 0.7−0.8.
We are unable to obtain high signal for the spectra retrieved from the sources in the final image of the reduced data cube for this particular target. Nevertheless, from the data we are able to see a higher signal in the H′-band with respect to the K′-band, and features resembling those of BD spectra for both the brighter source and fainter source in the image. Due to the faint nature of the sources and the poor quality of the spectra obtained for 2M1547, we cannot make a clear distinction for the spectral types of the sources and therefore cannot rule out the possibility that they are background sources. Nevertheless, given the small separation between the two components in the image frame, it is very likely that they are indeed part of the same system, and we calculate a chance projection of a background source of 5.7 ⋅ 10−5. We encourage follow-up observations of the target, which may clarify whether 2M1547 is a bona-fide young planetary-mass binary or not.
Incidentally, after applying the reduction from the development-level pipeline, correcting for atmospheric dispersion, we identify a third point-like source in the datacube that was not clearly visible in previous reduction attempts. The source is seen in the upper left of the upper middle image of Fig. 2, separated from the primary component by ∼220 mas and with a positional angle of ∼73°. We estimate the relative brightness of this potentially tertiary component as ≈0.40 times the brightness of the primary. Nevertheless, due to the ambiguous nature of the source and the issues with the data set for 2M1547, we do not include it in our final analysis and instead consider only the binary candidate.
3.4.3. 2MASS J22025794–5605087
The system has previously been identified as an M9 spectral type, with space velocities placing it as a high-probability member of the Tucana-Horologium (THA) moving group (Gagné et al. 2015). More recent results using updated Gaia DR2 parameters with proper motions μRA = 52.64 ± 0.66 mas yr−1, μDec = −77.13 ± 0.73 mas yr−1 and parallax π = 14.29 ± 0.48 mas with the BANYAN Σ tool suggest 2M2202 to be in the somewhat older AB Dor (ABD) moving group, which is consistent with the Convergence tool as well. Our spectral analysis of the individual components in the system, seen in Fig. 10, implies that both are consistent with M9γ and M9β spectral types, hinting that they are more than 100 Myr old, which agrees with the system belonging to the ABD moving group.
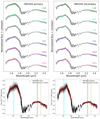 |
Fig. 10. Top row: empirical templates fitted to 2M2022. We find a best-fit model to be of M9γ/β ± 1 for both components, suggesting a pair of young BDs around ∼100 Myr old. Due to the small relative separation between the two components we expect there to be substantial contamination from each of them influencing the other. Nevertheless, we find that they are of almost equal brightness and expect them to share the same spectral type. The spectral type is consistent with the age of the AB Dor moving group at around 120–200 Myr, suggesting that the binary is a pair of ≈50 MJup BDs. Lower plots: best-fit theoretical evolutionary models from BT-Settl CIFIST to each individual component, where we find the Teff = 2800 K and logg = 3.5−4.0 models to be the best fit to both components. The light-blue, green, and yellow shaded areas indicate the spectral features from FeH, Na I, and CO, respectively. |
Visual inspection of the collapsed wavelength cube in the rightmost plot in Fig. 2 clearly shows two resolved individual components of almost equal brightness, with the southern component being slightly fainter, which we refer to as the binary component or 2M2202B. We calculate a chance projection of the fainter object being a background source with a probability of 2.4 × 10⁻⁶. Our astrometric solution, shown in Table 2, reveals the binary to have a projected separation of 60.36 ± 2.67 mas and positional angle of 59.51 ± 1.58 deg. We estimate a physical separation for the components by dividing the projected separation by the Gaia DR2 trigonometric parallax, and convert the separation to a statistical argument for the semi-major axis as with the other binaries. The predicted semi-major axis for the 2M2202 binary becomes a ≈ 4.8 AU, corresponding to an orbital period of P ≈ 34 years.
From the resolved photometry we fit the luminosity of each component to isochrones from the BT-Settle CIFIST models which yield primary and secondary masses of  and
and  , respectively, for the ABD MG age range of 120−200 Myr. Should the system in fact belong to the THA moving group instead, which has an age range of 20−40 Myr (Kraus et al. 2014), the estimated masses change to the mass range of ≈15−29 MJup. Regardless of adopted age, the mass ratio for the system is close to unity. The previous mass estimate by Gagné et al. (2014) of
  for the unresolved system employs similar evolutionary models as those used here but is likely to be an underestimate as these latter authors used a statistical distance of dstatistical = 48.6 pc instead of the more precise Gaia DR2 trigonometric parallax distance of dGaia = 70.0 pc. The difference in distance corresponds to a shift of about 0.8 in absolute magnitude, which in combination with the earlier-adopted younger age of THA explains the previous lower mass estimate.
The spectral analysis for the individual components for 2M2202 indicates both to be of M9β spectral type, which is expected due to their similar brightness and assumed age. However, the theoretical modeling is more degenerate, and is visualized in the lower plots of Fig. 10. We find best-fit models with effective temperatures of 2800 ± 100 K for both the primary and secondary, with surface gravities of logg = 4.0 ± 0.5. The theoretical spectra predict higher effective temperatures for the individual components compared to the isochrones from the same models, showing a discrepancy of about 400 K. Although the Teff = 2400 K models fit well with observed slope in the K′-band, in the H′-band the fit is worse compared to the higher-temperature models.
3.5. Singles or unresolved sources
The following sections contain more detailed information regarding the objects identified as single or unresolved substellar objects with no close-in companions. The same spectral analysis is performed for these objects as with the binaries, and we compile the empirical model comparison for all single objects in Fig. 5.
3.5.1. 2MASS J20334473–5635338
We classify 2M2033 as an L0γ dwarf and a likely member of the THA moving group. Our spectral analysis confirms the previous results that it is most likely a young L0 dwarf, and we obtain a best-fit theoretical model with effective temperature of Teff = 1600−100 K and surface gravity  , as shown in Fig. 11. The object has a statistical distance of about 55 pc (Gagné et al. 2015), but is lacking trigonometric parallax from Gaia DR2. A previous mass estimate by Gagné et al. (2015) indicates 13.5 MJup for the object, placing it close to the classical deuterium burning limit and making it a potential planetary mass substellar object.
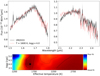 |
Fig. 11. Comparison of spectra for 2M2033 and theoretical models from the BT-Settl CIFIST library. Upper panels: observed flux in black where we have binned the observed flux into wavelength slices of five for a better signal-to-noise ratio, obtaining a wavelength resolution of Δλ = 25 Å, and using the standard deviation from the mean of the bins as the uncertainty, shown by the gray-shaded areas. The red lines depict the best-fit theoretical model, here with Teff = 1600−100 K and |

3.5.2. 2MASS J21171431–2940034
2MASS J21171431–2940034 is a single T0-type object with a distance of about 16.9 ± 1.7 pc (Best et al. 2015) and is likely a member of the β pic moving group. A previous mass estimate suggests a 6.5 MJup planetary mass object. Our spectral analysis finds a best fit for an effective temperature of Teff = 2000 with a surface gravity of logg = 5.0. However, as indicated by the theoretical spectral goodness-of-fit map shown in the bottom panel of Fig. 12, the theoretical models are highly degenerate for this object and there are several possible matches. Comparing isochrones from the same evolutionary models as employed in the spectral fit, we estimate from the brightness of 2M2117 that the effective temperature should be closer to ∼1000 K, which is in better agreement with the fitted spectral type of T0. We see from the grid-map in the lower plot in Fig. 12 that lower temperature models than our best fit are within the 1 − σ level from the goodness-of-fit statistics. Hence, we include the best-fit model from the lower-temperature plateau in the figure, corresponding to an effective temperature of Teff = 1400 K with a surface gravity of logg = 4.0 ± 0.5.
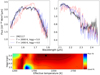 |
Fig. 12. Comparison of observed spectra for 2M2117 and theoretical models from the BT-Settle CIFIST library, as in Fig. 11, but with the best-fit model being |
3.5.3. 2MASS J22353560–5906306
2MASS J22353560–5906306 is likely a member of the THA moving group and was previously classed as a young M9β spectral type dwarf with an estimated mass of ≈20.6 MJup (Gagné et al. 2015). Gaia DR2 shows proper motions of μRA = 59.37 ± 0.39 mas yr−1 and μDec = −83.76 ± 0.43 mas yr−1, with a trigonometric parallax pointing to a distance of ≈46 pc for the object (Lindegren et al. 2018). Our spectral analysis finds a best-fit spectral type of M9γ for the source and a theoretical model close to an effective temperature of Teff = 2700 ± 400 K and surface gravity of logg ≥ 3.5, shown in Fig. 13. We note that there is a huge discrepancy in effective temperature of ≈1000 K and magnitude of ≈1.5 mag between the sources 2M2033 and 2M22353, despite them having similar spectral types of M9 and L0, respectively. This oddity is enhanced by the fact that both of these objects are likely members of the THA young moving group, although it is not unheard of for BDs of similar spectral types to have dissimilar temperatures and brightnesses (e.g., 2M1610-1913 Lachapelle et al. 2015, or 2M1510 here).
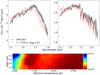 |
Fig. 13. Comparison of observed spectra for 2M22353 and theoretical models from the BT-Settle CIFIST library, as in Fig. 11, but with the best-fit model being Teff = 2700 ± 400 K with logg ≤ 3.5. |
3.5.4. 2MASS J23225299–6151275
2MASS J23225299–6151275 is potentially part of a wider binary system together with the low-mass M5 type dwarf 2MASS J23225240–6151114 (e.g., Gagné et al. 2015), sharing similar trigonometric parallax and proper motions according to the Gaia DR2 release. The target was previously determined to be a L1γ BD by Gagné et al. (2015), but later estimated by Koen et al. (2017) to be of slightly later type, that is, L2.5 BD. We find similar results and obtain good fits for L1γ ± 2 spectral templates. We find theoretical models to be best fitted with an effective temperature of Teff = 1600 ± 100 K and with a surface gravity of logg = 4.0 ± 0.5, shown in Fig. 14. Using the Gaia DR2 proper motions of μRA = 80.09 ± 1.45 mas yr−1 and μDec = −81.97 ± 1.62 mas yr−1 with the BANYAN Σ tool associates 2M2322 to the THA moving group, and the trigonometric parallax of π = 23.24 mas places it at a distance of ≈43 pc, yielding an isochronal mass of ≈13 MJup.
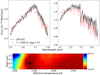 |
Fig. 14. Comparison of observed spectra for 2M2322 and theoretical models from the BT-Settle CIFIST library, as in Fig. 11, but with the best-fit model being Teff = 1600 ± 100 K with logg = 4.0 ± 0.5. |
4. Discussion and summary
The combination of the small working angle of the observations and the resolved spectra allows us to accurately constrain 2M1510 and 2M2202 as binary BDs. Both targets show strong signs of youth and share space velocities with the Argus YMG and ABD MG, respectively, which, in combination with the assumption that that all members of the YMGs are coeval, constrains their ages even further to 30−50 Myr for 2M1510 and 120−200 Myr for 2M2202. We also find a tentative binary BD in the young field, 2M1547, predicted to have an age of 30−50 Myr according to isochronal fits of the near-IR photometry. The main reason for 2M1547 only being a binary candidate comes from the poor quality of the observations of the target, where the source appeared to be much fainter than expected based on 2MASS photometry. We are not certain why the observations of 2M1547 were of poorer quality than expected, but it is possible that thin local clouds got in the way at the crucial moment of the exposures. Nevertheless, we verify that the coordinates for the observations are indeed correct and that no other source of similar faint nature should be present in the vicinity. The observations also lacked proper sky subtraction, and so we resorted to subtracting post-processed sky frames from observations immediately before and after 2M1547 was observed. However, we calculate a likelihood for chance projection that the detected binary candidate components are not being physically bound to be on the order of 10−5 and therefore almost negligible. We summarize the observations and YMG membership status in Table 1 for all observed targets.
Using standard stars observed on the same nights as our targets, we employ a PSF-matching algorithm to model the relative brightness and positions of the resolved components of the binaries. From the relative positions of the detected companions we deduce the projected separation of the binaries to be ≈100 mas for 2M1510 and ≈60 mas for 2M2202, corresponding to physical separations of ≈4−5 AU for the adopted distances. The binary candidate to 2M1547 has a larger separation of ≈170 mas, corresponding to a physical separation of ≈6.0 AU. These small separations can be related to the expected period of the binaries, which translates to a few decades for 2M1510 and 2M2202, and about 100 years for 2M1547. We summarize the astrometry for the binaries in Table 2.
From the relative brightnesses of the binary components and comparing their ages to isochrones from the BT-Settle CIFIST (Baraffe et al. 2015) evolutionary models we predict individual masses. We obtain that 2M1510 is likely composed of a 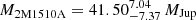 primary and a secondary BD with
 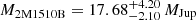 , or perhaps even lower in mass as the PSF is somewhat smeared out and we are likely to obtain a significant brightness contamination contribution from the primary. We obtain that 2M2202 is an almost equal-mass binary, with the primary component mass as
 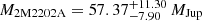 and the secondary with
  . We find the total mass of 2M2202 to be higher than previous results from Gagné et al. (2015) due to the updated distance measurements and space velocities from Gaia, thus constraining its YMG membership and adopted age. For the binary candidate 2M1547 we predict masses of
 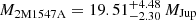 and
and 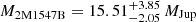 , and both of the components are close to the classical deuterium-burning limit, making it an interesting binary system from an evolutionary perspective. We compile the photometric and mass results in Table 2, where we predict the masses using isochrones from the evolutionary models and the ages stated in the table. We note that using the lower ages of the YMGs would lower the masses further, but in some cases the models break down at these very low masses and ages. There may also be an issue for dusty and cloudless substellar evolutionary models to correctly predict cooling rates as Dupuy et al. (2014) point out, suggesting that model-derived masses may be overestimated.
Here, we keep our calculations simplified by applying the same models for the isochrones as for the theoretical spectral analysis but note that different evolutionary models may yield divergent results. We also notice some discrepancy in the comparison between isochrones and spectral fitting, where the best-fit spectra to our objects produce higher effective temperatures than the isochrones, but lower surface gravity. We can attribute these discrepancies partly to assuming solar metallicities for the models, which is not necessarily the case for our young objects; Viana Almeida et al. (2009) find for instance that the ABD MG has a somewhat supersolar metallicity of [Fe/H]ABD = 0.04 ± 0.05, that the Argus group has [Fe/H]ARG = 0.02 ± 0.06, and that the THA has [Fe/H]THA = −0.03 ± 0.05. Furthermore, we note a strong degeneracy with the theoretical models when attempting to match the models to the observed spectra. By alternating effective temperatures and surface gravities we achieve very similar values in our goodness-of-fit calculations and shapes in the spectra. For the 2M1510 binary we can attribute some of this degeneracy to the only partly resolved spectra, where the brightness of the primary clearly contaminates the secondary component and its spectrum. We also cannot rule out the possibility of unresolved components of different spectral types that causes models of very different values of Teff and logg to produce good fits.
We construct empirical templates for different spectral types using a selection of known objects, as well as using already existing templates to try to constrain the spectral types of our targets and discovered binaries. In most cases we robustly verify previous indications, and for the partly resolved 2M1510 binary candidate the spectrum of the companion is too contaminated to yield constrained results. We do note however that the empirical models for the binary companion agree well with a later spectral type than that of the primary.
Assuming that the targets in our observations are true members of their respective YMG, and that all members are coeval, we identify two out of six YMG substellar objects to be binaries, with the addition of one strong binary candidate from the young field population of substellar BDs. The sample provided here is too small to set stringent constraints on the multiplicity for young low-mass substellar objects. We do however provide three new binary systems in this scarcely probed regime of low-mass and young objects, along with four likely single systems that may also be used for future multiplicity studies. The very narrow field of view of the observations taken here of 0.8″ × 0.8″ is only viable for searching for binaries on small separations, and is therefore well-suited to our targets. From our sample of seven observed targets, we find three to be binary candidates, leading to a multiplicity frequency of ≈43 ± 19% for BDs with projected separations effectively smaller than ≈400 mas. Such a number has been speculated for the overall multiplicity rate of BD–BD pairs based on color-magnitude diagrams and radial velocity variation statistics (Pinfield et al. 2003; Maxted & Jeffries 2005). Although we are dealing with a very small sample, we cannot rule out that this could provide some indication that young systems in this mass range have a higher multiplicity frequency than their older field counterpart. This could also be related to the narrow separations which would have been difficult to detect in other surveys.
We identify 2M1510 as a close-in binary pair, which is of particular interest from a dynamical and hierarchical point of view, already being in a well-separated binary system with at least one of the components having an eclipsing binary and another close-in companion. Such circumbinary systems would be of interest for studying formation channels and dynamical evolution of young BD–BD systems, which can be compared to previous multiple studies of more massive close-in binaries with circumbinary companions (e.g., Asensio-Torres et al. 2018). The fact that our binary candidates are all on small separations supports the formation scenarios of BDs as a substellar extension of the low-mass stellar initial-mass function (e.g., Goodwin & Whitworth 2007; Luhman 2012). In order to test a wider range of formation scenarios, multiplicity studies of even younger systems than those observed here would be required, for example in star-forming regions such as Taurus, Chamaeleon I, or Scorpius–Centaurus.
The small separations for the three candidate binary systems detected here are on the order of a few astronomical units, which combined with their predicted masses from substellar evolutionary models yield Keplerian orbital periods of just a few decades for the most close-in binaries 2M1510 and 2M2202. Our spectral analysis suggests an unambiguous spectral class of M9β for both components to 2M2022, implying that the system is indeed a bona-fide substellar binary. Based on the previous discussion in Sect. 3.4.1, we deem 2M1510 to be a strong BD binary candidate on the basis that the shape of the spectra are slightly different and that a point source is identified after subtracting a model PSF from the bright main component. Nevertheless, we advocate second-epoch follow-up observations of 2M1510 and 2M1547 in order to verify common proper motions and their binarity status. Given small separations and periods of just a few decades, Keplerian orbits can be fitted within just a few years of monitoring of these three systems, which typically can be done after monitoring only approximately one third of the orbit, thus yielding dynamical masses within a relatively short time. Since the ages are already constrained from the YMGs, these systems will be excellent benchmarks for calibrating theoretical models in this very low-mass regime.
ESO Proposal ID 299.C-5046(A) – http://archive.eso.org/wdb/wdb/eso/abstract/query?ID=9950460progid=299.C-5046%28A%29
Acknowledgments
M.J. gratefully acknowledges funding from the Knut and Alice Wallenberg foundation. This research has benefitted from the SpeX Prism Library (and/or SpeX Prism Library Analysis Toolkit), maintained by Adam Burgasser at http://www.browndwarfs.org/spexprism. This research has benefitted from the Montreal Brown Dwarf and Exoplanet Spectral Library, maintained by Jonathan Gagné. This work has made use of data from the European Space Agency (ESA) mission Gaia (https://www.cosmos.esa.int/gaia), processed by the Gaia Data Processing and Analysis Consortium (DPAC, https://www.cosmos.esa.int/web/gaia/dpac/consortium). Funding for the DPAC has been provided by national institutions, in particular the institutions participating in the Gaia Multilateral Agreement.
References
- Asensio-Torres, R., Janson, M., Bonavita, M., et al. 2018, A&A, 619, A43 [NASA ADS] [CrossRef] [EDP Sciences] [Google Scholar]
- Asensio-Torres, R., Currie, T., Janson, M., et al. 2019, A&A, 622, A42 [NASA ADS] [CrossRef] [EDP Sciences] [Google Scholar]
- Baraffe, I., Homeier, D., Allard, F., & Chabrier, G. 2015, A&A, 577, A42 [NASA ADS] [CrossRef] [EDP Sciences] [Google Scholar]
- Best, W. M. J., Liu, M. C., Magnier, E. A., et al. 2015, ApJ, 814, 118 [NASA ADS] [CrossRef] [Google Scholar]
- Best, W. M. J., Liu, M. C., Dupuy, T. J., & Magnier, E. A. 2017, ApJ, 843, L4 [NASA ADS] [CrossRef] [Google Scholar]
- Bonnefoy, M., Chauvin, G., Lagrange, A.-M., et al. 2014, A&A, 562, A127 [NASA ADS] [CrossRef] [EDP Sciences] [Google Scholar]
- Bonnet, H., Abuter, R., Baker, A., et al. 2004, The Messenger, 117, 17 [NASA ADS] [Google Scholar]
- Bouy, H., Brandner, W., Martín, E. L., et al. 2003, AJ, 126, 1526 [NASA ADS] [CrossRef] [Google Scholar]
- Burgasser, A. J. 2014, ASI Conf. Ser., 11 [Google Scholar]
- Burgasser, A. J., Kirkpatrick, J. D., Cruz, K. L., et al. 2006, ApJS, 166, 585 [NASA ADS] [CrossRef] [Google Scholar]
- Burgasser, A. J., Reid, I. N., Siegler, N., et al. 2007, Protostars Planets V, 427 [Google Scholar]
- Burgasser, A. J., Logsdon, S. E., Gagné, J., et al. 2015, ApJS, 220, 18 [NASA ADS] [CrossRef] [Google Scholar]
- Calissendorff, P., & Janson, M. 2018, A&A, 615, A149 [NASA ADS] [CrossRef] [EDP Sciences] [Google Scholar]
- Calissendorff, P., Janson, M., Köhler, R., et al. 2017, A&A, 604, A82 [NASA ADS] [CrossRef] [EDP Sciences] [Google Scholar]
- Chauvin, G., Lagrange, A.-M., Dumas, C., et al. 2004, A&A, 425, L29 [NASA ADS] [CrossRef] [EDP Sciences] [MathSciNet] [Google Scholar]
- Chiu, K., Fan, X., Leggett, S. K., et al. 2006, AJ, 131, 2722 [NASA ADS] [CrossRef] [Google Scholar]
- Close, L. M., Siegler, N., Freed, M., & Biller, B. 2003, ApJ, 587, 407 [NASA ADS] [CrossRef] [Google Scholar]
- Correia, S., Zinnecker, H., Ratzka, T., & Sterzik, M. F. 2006, A&A, 459, 909 [NASA ADS] [CrossRef] [EDP Sciences] [Google Scholar]
- Cushing, M. C., Marley, M. S., Saumon, D., et al. 2008, ApJ, 678, 1372 [NASA ADS] [CrossRef] [Google Scholar]
- Delfosse, X., Beuzit, J.-L., Marchal, L., et al. 2004, in Spectroscopically and Spatially Resolving the Components of the Close Binary Stars, 318, 166 [NASA ADS] [Google Scholar]
- Duchêne, G., & Kraus, A. 2013, ARA&A, 51, 269 [Google Scholar]
- Dupuy, T. J., & Liu, M. C. 2011, ApJ, 733, 122 [NASA ADS] [CrossRef] [Google Scholar]
- Dupuy, T. J., & Liu, M. C. 2012, ApJS, 201, 19 [NASA ADS] [CrossRef] [Google Scholar]
- Dupuy, T. J., Liu, M. C., & Ireland, M. J. 2009, ApJ, 692, 729 [NASA ADS] [CrossRef] [Google Scholar]
- Dupuy, T. J., Liu, M. C., & Ireland, M. J. 2014, ApJ, 790, 133 [NASA ADS] [CrossRef] [Google Scholar]
- Dupuy, T. J., Liu, M. C., & Leggett, S. K. 2015, ApJ, 803, 102 [NASA ADS] [CrossRef] [Google Scholar]
- Dupuy, T. J., Liu, M. C., Allers, K. N., et al. 2018, AJ, 156, 57 [NASA ADS] [CrossRef] [Google Scholar]
- Duquennoy, A., & Mayor, M. 1991, A&A, 248, 485 [NASA ADS] [Google Scholar]
- Eisenhauer, F., Abuter, R., Bickert, K., et al. 2003, SPIE, 4841, 1548 [NASA ADS] [Google Scholar]
- Faherty, J. K., Riedel, A. R., Cruz, K. L., et al. 2016, ApJS, 225, 10 [NASA ADS] [CrossRef] [Google Scholar]
- Fischer, D. A., & Marcy, G. W. 1992, ApJ, 396, 178 [NASA ADS] [CrossRef] [Google Scholar]
- Fontanive, C., Biller, B., Bonavita, M., & Allers, K. 2018, MNRAS, 479, 2702 [NASA ADS] [CrossRef] [Google Scholar]
- Freudling, W., Romaniello, M., Bramich, D. M., et al. 2013, A&A, 559, A96 [NASA ADS] [CrossRef] [EDP Sciences] [Google Scholar]
- Gagné, J., Lafrenière, D., Doyon, R., Malo, L., & Artigau, É. 2014, ApJ, 783, 121 [NASA ADS] [CrossRef] [Google Scholar]
- Gagné, J., Faherty, J. K., Cruz, K. L., et al. 2015, ApJS, 219, 33 [NASA ADS] [CrossRef] [Google Scholar]
- Gagné, J., Mamajek, E. E., Malo, L., et al. 2018, ApJ, 856, 23 [NASA ADS] [CrossRef] [Google Scholar]
- Gaia Collaboration (Brown, A. G. A., et al.) 2018, A&A, 616, A1 [NASA ADS] [CrossRef] [EDP Sciences] [Google Scholar]
- Gelino, C. R., Kirkpatrick, J. D., Cushing, M. C., et al. 2011, AJ, 142, 57 [NASA ADS] [CrossRef] [Google Scholar]
- Gizis, J. E. 2002, ApJ, 575, 484 [NASA ADS] [CrossRef] [Google Scholar]
- Goodwin, S. P., & Whitworth, A. 2007, A&A, 466, 943 [NASA ADS] [CrossRef] [EDP Sciences] [Google Scholar]
- Huélamo, N., Ivanov, V. D., Kurtev, R., et al. 2015, A&A, 578, A1 [NASA ADS] [CrossRef] [EDP Sciences] [Google Scholar]
- Janson, M., Hormuth, F., Bergfors, C., et al. 2012, ApJ, 754, 44 [NASA ADS] [CrossRef] [Google Scholar]
- Janson, M., Bergfors, C., Brandner, W., et al. 2014, ApJ, 789, 102 [Google Scholar]
- Kirkpatrick, J. D., Barman, T. S., Burgasser, A. J., et al. 2006, ApJ, 639, 1120 [NASA ADS] [CrossRef] [Google Scholar]
- Koen, C., Miszalski, B., Väisänen, P., & Koen, T. 2017, MNRAS, 465, 4723 [NASA ADS] [CrossRef] [Google Scholar]
- Kouwenhoven, M. B. N., Brown, A. G. A., Portegies Zwart, S. F., & Kaper, L. 2007, A&A, 474, 77 [NASA ADS] [CrossRef] [EDP Sciences] [Google Scholar]
- Kraus, A. L., & Hillenbrand, L. A. 2012, ApJ, 757, 141 [NASA ADS] [CrossRef] [Google Scholar]
- Kraus, A. L., Shkolnik, E. L., Allers, K. N., & Liu, M. C. 2014, AJ, 147, 146 [NASA ADS] [CrossRef] [Google Scholar]
- Lachapelle, F.-R., Lafrenière, D., Gagné, J., et al. 2015, ApJ, 802, 61 [NASA ADS] [CrossRef] [Google Scholar]
- Lafrenière, D., Jayawardhana, R., van Kerkwijk, M. H., Brandeker, A., & Janson, M. 2014, ApJ, 785, 47 [NASA ADS] [CrossRef] [Google Scholar]
- Lindegren, L., Hernández, J., Bombrun, A., et al. 2018, A&A, 616, A2 [NASA ADS] [CrossRef] [EDP Sciences] [Google Scholar]
- Liu, M. C., Dupuy, T. J., Bowler, B. P., Leggett, S. K., & Best, W. M. J. 2012, ApJ, 758, 57 [NASA ADS] [CrossRef] [Google Scholar]
- Luhman, K. L. 2012, ARA&A, 50, 65 [NASA ADS] [CrossRef] [Google Scholar]
- Luhman, K. L. 2013, ApJ, 767, L1 [NASA ADS] [CrossRef] [Google Scholar]
- Malo, L., Doyon, R., Lafrenière, D., et al. 2013, ApJ, 762, 88 [NASA ADS] [CrossRef] [Google Scholar]
- Marleau, G.-D., & Cumming, A. 2014, MNRAS, 437, 1378 [NASA ADS] [CrossRef] [Google Scholar]
- Maxted, P. F. L., & Jeffries, R. D. 2005, MNRAS, 362, L45 [NASA ADS] [CrossRef] [Google Scholar]
- Padoan, P., & Nordlund, Å. 2004, ApJ, 617, 559 [NASA ADS] [CrossRef] [Google Scholar]
- Peter, D., Feldt, M., Henning, T., & Hormuth, F. 2012, A&A, 538, A74 [NASA ADS] [CrossRef] [EDP Sciences] [Google Scholar]
- Pinfield, D. J., Dobbie, P. D., Jameson, R. F., et al. 2003, MNRAS, 342, 1241 [NASA ADS] [CrossRef] [Google Scholar]
- Pomohaci, R., Oudmaijer, R. D., & Goodwin, S. P. 2019, MNRAS, 484, 226 [NASA ADS] [CrossRef] [Google Scholar]
- Raghavan, D., McAlister, H. A., Henry, T. J., et al. 2010, ApJS, 190, 1 [NASA ADS] [CrossRef] [EDP Sciences] [Google Scholar]
- Reipurth, B., & Clarke, C. 2001, AJ, 122, 432 [NASA ADS] [CrossRef] [Google Scholar]
- Robert, J., Gagné, J., Artigau, É., et al. 2016, ApJ, 830, 144 [NASA ADS] [CrossRef] [Google Scholar]
- Rodriguez, D. R., Zuckerman, B., Kastner, J. H., et al. 2013, ApJ, 774, 101 [NASA ADS] [CrossRef] [Google Scholar]
- Skrutskie, M. F., Cutri, R. M., Stiening, R., et al. 2006, AJ, 131, 1163 [NASA ADS] [CrossRef] [Google Scholar]
- Spiegel, D. S., Burrows, A., & Milsom, J. A. 2011, ApJ, 727, 57 [NASA ADS] [CrossRef] [Google Scholar]
- Viana Almeida, P., Santos, N. C., Melo, C., et al. 2009, A&A, 501, 965 [NASA ADS] [CrossRef] [EDP Sciences] [Google Scholar]
- Wright, E. L., Eisenhardt, P. R. M., Mainzer, A. K., et al. 2010, AJ, 140, 1868 [NASA ADS] [CrossRef] [Google Scholar]
- Zuckerman, B., Bessell, M. S., Song, I., & Kim, S. 2006, ApJ, 649, L115 [NASA ADS] [CrossRef] [Google Scholar]
All Tables
Compiled results for the observed targets including photometry and astrometry for the binary candidates.
All Figures
|
Fig. 1. PSF-matching for the binary 2M2202. Upper left and right plots: observed data and PSF of the standard star used, respectively. Lower left plot: best fit of a constructed model made from two reference PSFs that we match to the positions and scale with the brightness of the two components. Lower right plot: residuals after subtracting the model from the observed data. All plots have been normalized to match the observed data. |
| In the text | |
|
Fig. 2. Upper images: collapsed data cubes of all observed frames for the detected binary candidates; 2M1510 (left), 2M1547 (middle), and 2M2022 (right). Lower images: corresponding relevant point source reference used in the fitting procedure of the astrometric measurements. Special care is taken for 2M1510 where we find no suitable standard reference star to match the PSF of the BD binary components, and thus an unresolved 2D Gaussian function is fitted to the entire system which is further explained in Sect. 3.4.1. For 2M1547 we note a third point source in the upper left part of the image which we do not include in our analysis since it was weak and appeared artefact-like in our original data reduction that did not correct for atmospheric dispersion. Derived astrometric parameters and photometry for each individual object are seen in Table 2. The scaling in each individual image is chosen to better highlight the individual components. North is up and east is to the left in the figures. |
| In the text | |
|
Fig. 3. Color-magnitude diagram showing our observed targets together with known substellar objects from the literature. The blue, magenta, and yellow markers show the binary candidates 2M1510, 2M1547, and 2M2202, respectively, where the primaries are illustrated by the diamonds and the squares represent the secondary binary components. Unresolved and single sources in our survey are shown by circles only. We include low-mass stars and BDs from Dupuy & Liu (2012) as smaller circles, which have been color coded on a spectrum shown by the color bar in the figure, going from late M type to early T type. We only include objects from the list that have known spectral type and Gaia parallaxes. The gray triangles show low-mass objects from the BANYAN survey (Gagné et al. 2015), where the downward-pointing triangles show field dwarfs, and the upward-pointing triangles show objects with low surface gravity and strong signs of youth. Photometry is based on 2MASS bands for all sources. Most of our sources seem to be on the redder side in the diagram, suggesting some extinction by being dusty, which could be considered as a sign of youth. |
| In the text | |
|
Fig. 4. Examples of the composite spectral templates produced from the median of several empirical spectra from the literature. The composite templates for late M and early spectral types with surface gravity indices γ and β are constructed by taking the median of several objects from the Montreal spectral library (Gagné et al. 2015; Robert et al. 2016). For T-types we construct median template spectra from known T-types in the SpeX Prism Library (Burgasser 2014) and the Sloan Digital Sky Survey (Chiu et al. 2006). The templates have typical resolution of Δλ ≈ 5−40 Å. |
| In the text | |
|
Fig. 5. Empirical spectral templates fitted to the unresolved single sources with no detected companions. The spectra are smoothed to match the resolution of the templates, and then scaled and fitted according to Eq. (1). |
| In the text | |
|
Fig. 6. Cumulative distribution of 2MASS point sources of different H-band magnitudes in a 15′ radius around our detected binary candidates, represented by the red line for 2M1510, the green line for 2M1547, and the blue line for 2M2202. The dashed lines indicate the secondary component H′-band magnitude for each respective binary and the corresponding cumulative number of point sources that are brighter in the field. The field around 2M2202 is somewhat less dense than that around the other two, and the estimated chance of any of our binary candidates being a background source is on the order of ∼10−5 or smaller. |
| In the text | |
|
Fig. 7. Isochrones showing the theoretical masses inferred from the BT-Settl CIFIST evolutionary models for the binaries presented in this work. The primary and secondary components are depicted by the upper and lower solid lines for each respective source, and the shaded colored areas represent the uncertainty in the mass-estimates from the luminosities. The plot has a discontinuity in the age-range on the x-axis, showing only the ages of relevance for the objects included, and not featuring ages between 50 and 120 Myr. We note that alternative isochrone models may predict other masses for the same ages and luminosities, and our choice of models is based on consistency with the theoretical spectral models employed in our analysis. |
| In the text | |
|
Fig. 8. Snapshots of the collapsed data cube in the H′+K′-band for the binary candidate 2M1510. (A) Observed data. (B) Model of the data where the PSF has been placed over the primary and secondary positions and scaled to match their relative brightnesses. (C) Residual after subtracting the model primary component from the observed data. (D) Residual after subtracting the model secondary component from the observed data. All snapshots have been normalized to match the observed data, using a different scaling compared to Fig. 2. The fainter component is visible in all of the data cubes obtained from the observations. |
| In the text | |
|
Fig. 9. Top row: empirical templates fitted to the spectra of the components to 2M1510, suggesting best fits for M9γ or an earlier type for both components. Due to the contrast and proximity of the companion to the primary, it is very likely that much of the shape of the spectrum of the secondary component is contributed by the primary. The companion is about 0.2 times the brightness of the primary, and it is unlikely they would be of the same spectral type (although this discrepancy may be mitigated if the primary is an unresolved binary). Lower plots: best-fit theoretical evolutionary models from BT-Settl CIFIST to each individual component. We find the best-fit models to be Teff = 2700 K with logg = 3.5 for the primary and Teff = 2700 K with logg = 4.5 for the secondary. The contrast in magnitude between the components is estimated to be ΔMH ≈ 2, and we would expect the secondary component to be cooler than what is predicted by our best-fit model. |
| In the text | |
|
Fig. 10. Top row: empirical templates fitted to 2M2022. We find a best-fit model to be of M9γ/β ± 1 for both components, suggesting a pair of young BDs around ∼100 Myr old. Due to the small relative separation between the two components we expect there to be substantial contamination from each of them influencing the other. Nevertheless, we find that they are of almost equal brightness and expect them to share the same spectral type. The spectral type is consistent with the age of the AB Dor moving group at around 120–200 Myr, suggesting that the binary is a pair of ≈50 MJup BDs. Lower plots: best-fit theoretical evolutionary models from BT-Settl CIFIST to each individual component, where we find the Teff = 2800 K and logg = 3.5−4.0 models to be the best fit to both components. The light-blue, green, and yellow shaded areas indicate the spectral features from FeH, Na I, and CO, respectively. |
| In the text | |
|
Fig. 11. Comparison of spectra for 2M2033 and theoretical models from the BT-Settl CIFIST library. Upper panels: observed flux in black where we have binned the observed flux into wavelength slices of five for a better signal-to-noise ratio, obtaining a wavelength resolution of Δλ = 25 Å, and using the standard deviation from the mean of the bins as the uncertainty, shown by the gray-shaded areas. The red lines depict the best-fit theoretical model, here with Teff = 1600−100 K and |
| In the text | |
|
Fig. 12. Comparison of observed spectra for 2M2117 and theoretical models from the BT-Settle CIFIST library, as in Fig. 11, but with the best-fit model being |
| In the text | |
|
Fig. 13. Comparison of observed spectra for 2M22353 and theoretical models from the BT-Settle CIFIST library, as in Fig. 11, but with the best-fit model being Teff = 2700 ± 400 K with logg ≤ 3.5. |
| In the text | |
|
Fig. 14. Comparison of observed spectra for 2M2322 and theoretical models from the BT-Settle CIFIST library, as in Fig. 11, but with the best-fit model being Teff = 1600 ± 100 K with logg = 4.0 ± 0.5. |
| In the text | |
Current usage metrics show cumulative count of Article Views (full-text article views including HTML views, PDF and ePub downloads, according to the available data) and Abstracts Views on Vision4Press platform.
Data correspond to usage on the plateform after 2015. The current usage metrics is available 48-96 hours after online publication and is updated daily on week days.
Initial download of the metrics may take a while.