Fig. 9.
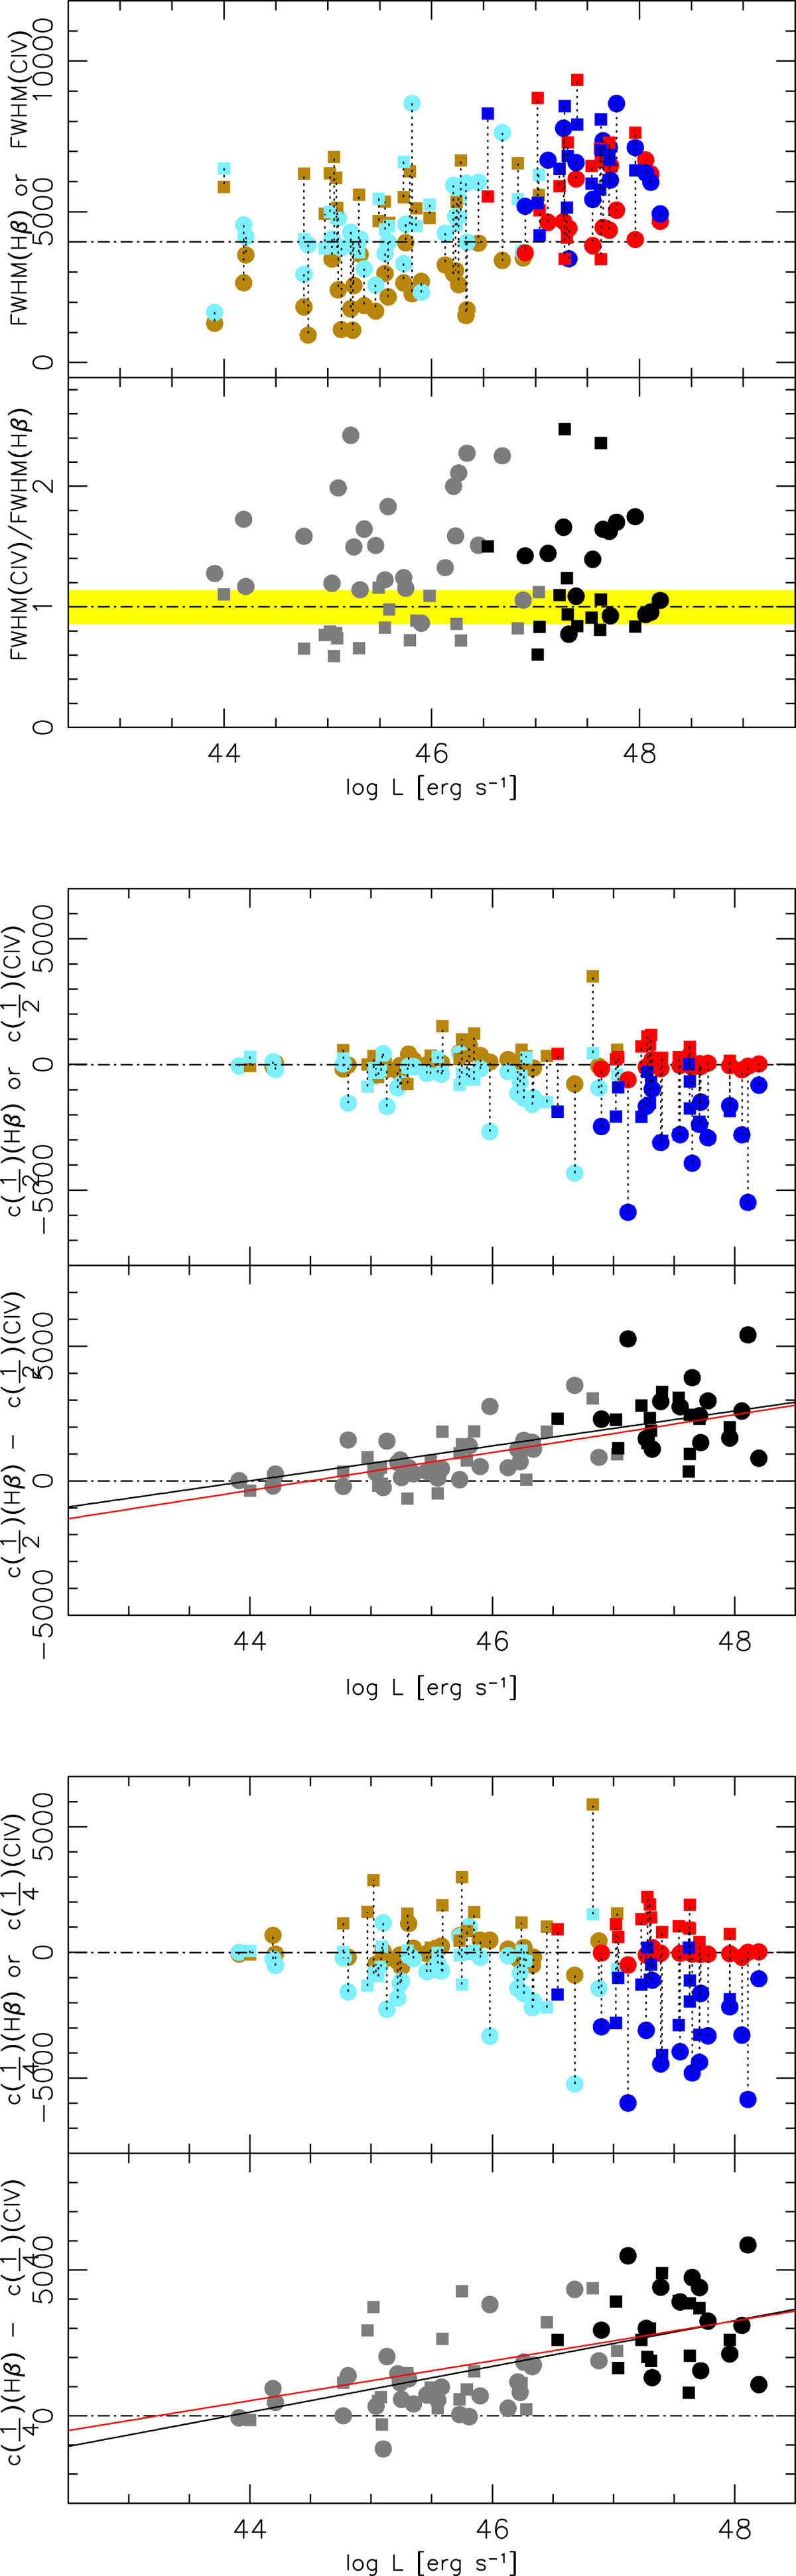
Hβ and C IVλ1549 profile parameter comparison as a function of luminosity. Top panels: behavior of FWHM C IVλ1549 and Hβ (upper half) and of the ratio FWHM(C IVλ1549)/FWHM(Hβ) as a function of L (lower half), for FOS (golden and pale blue) and HE sample (red and blue). The yellow band identifies the region where FWHM(C IVλ1549)/FWHM(Hβ) = 1 within the errors. Middle panels: ![]() of Hβ and C IVλ1549 (upper half), and difference
of Hβ and C IVλ1549 (upper half), and difference ![]() as a function of L (lower half). Square symbols indicate Pop. B, circles Pop. A. Lines trace an unweighted least-squares fit for the Pop. A (black) and for Pop. B (red) sources. Bottom panels: as in top panels but for
as a function of L (lower half). Square symbols indicate Pop. B, circles Pop. A. Lines trace an unweighted least-squares fit for the Pop. A (black) and for Pop. B (red) sources. Bottom panels: as in top panels but for ![]() and
and ![]() . The vertical dotted lines join Hβ and C IVλ1549 parameters for the same object (e.g., they are not error bars).
. The vertical dotted lines join Hβ and C IVλ1549 parameters for the same object (e.g., they are not error bars).
Current usage metrics show cumulative count of Article Views (full-text article views including HTML views, PDF and ePub downloads, according to the available data) and Abstracts Views on Vision4Press platform.
Data correspond to usage on the plateform after 2015. The current usage metrics is available 48-96 hours after online publication and is updated daily on week days.
Initial download of the metrics may take a while.