Free Access
Fig. 6.
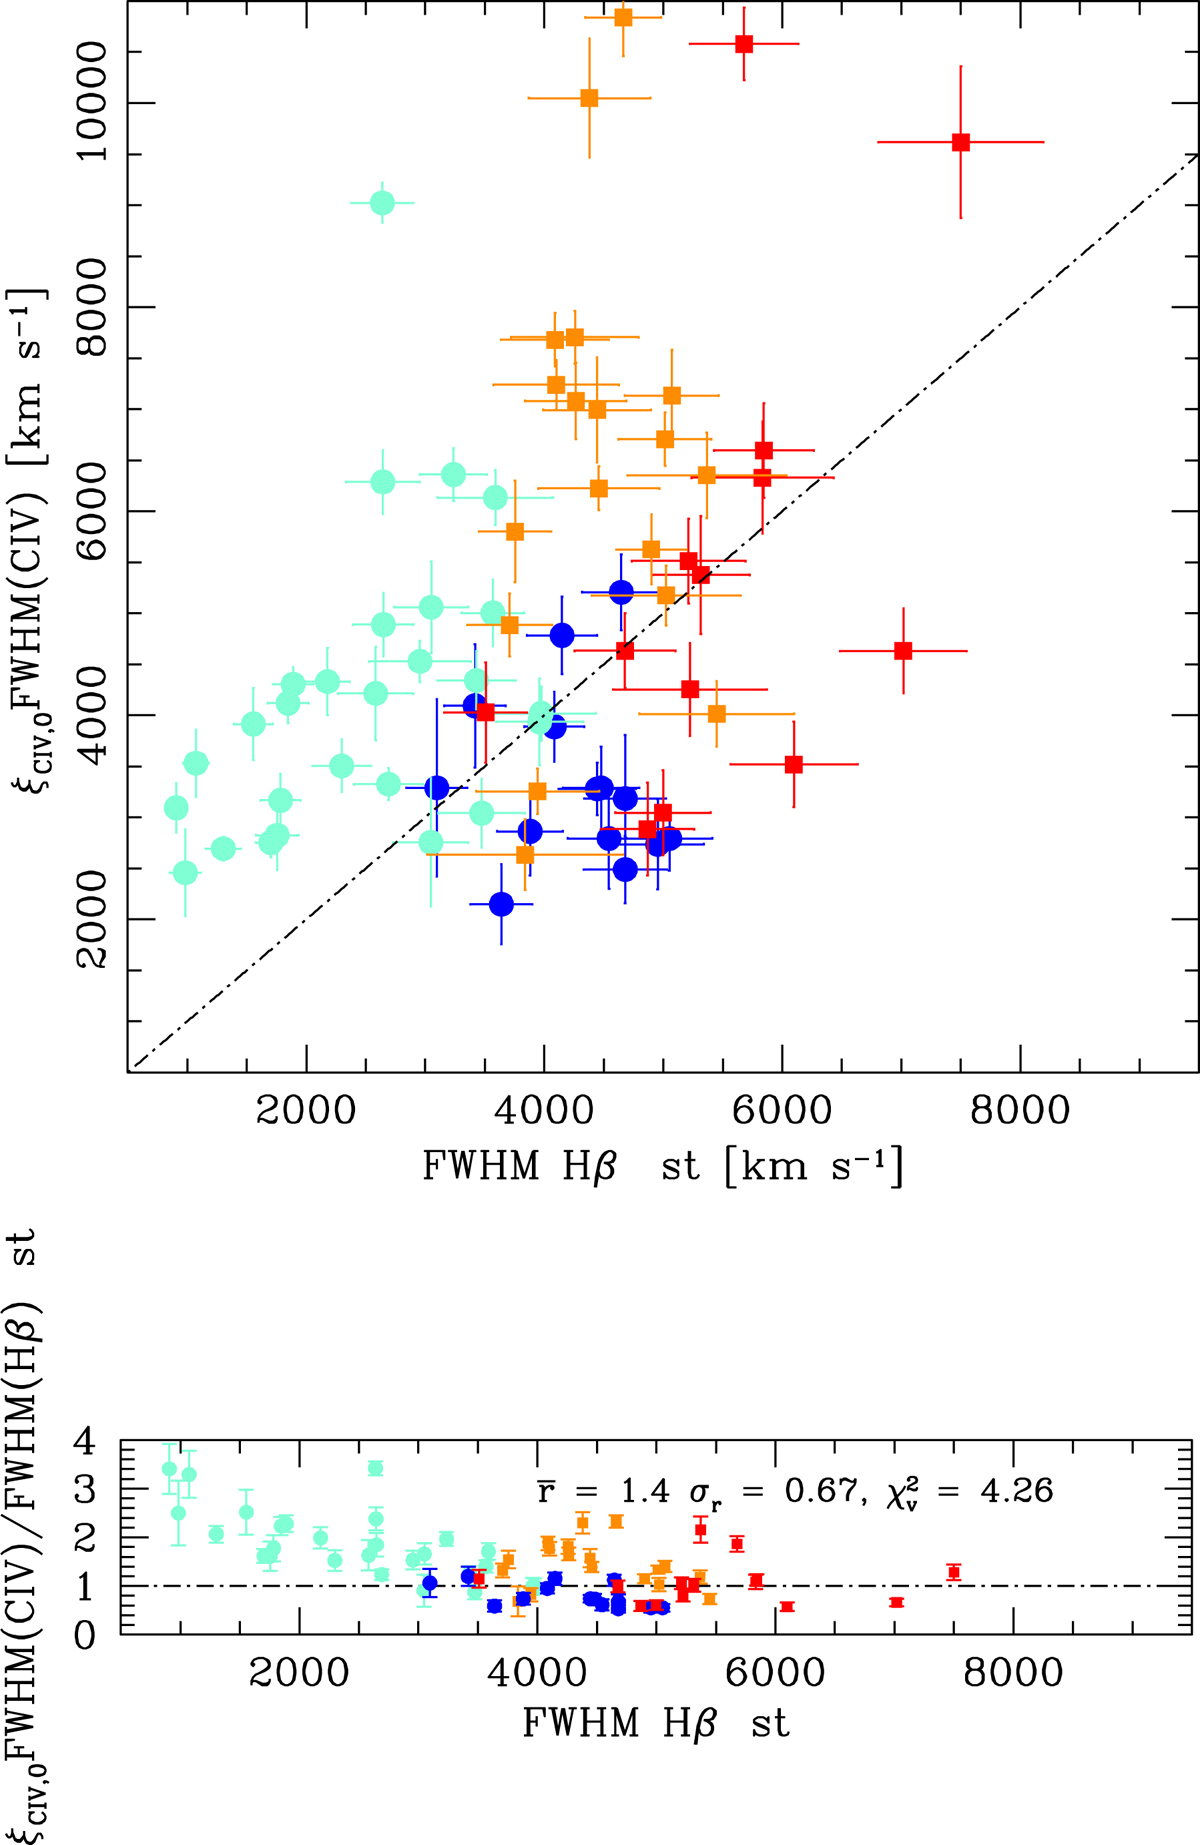
Top panel: FWHM(C IVλ1549) C16 (i.e., corrected following Coatman et al. 2016), vs. FWHM(Hβ) st for the FOS+HE sample. Meaning of symbols is the same as for Fig. 3. The black dot-dashed line is the equality line. Bottom panel: residuals. Average ratio, dispersion, and ![]() refer to all sources.
refer to all sources.
Current usage metrics show cumulative count of Article Views (full-text article views including HTML views, PDF and ePub downloads, according to the available data) and Abstracts Views on Vision4Press platform.
Data correspond to usage on the plateform after 2015. The current usage metrics is available 48-96 hours after online publication and is updated daily on week days.
Initial download of the metrics may take a while.