Fig. 4.
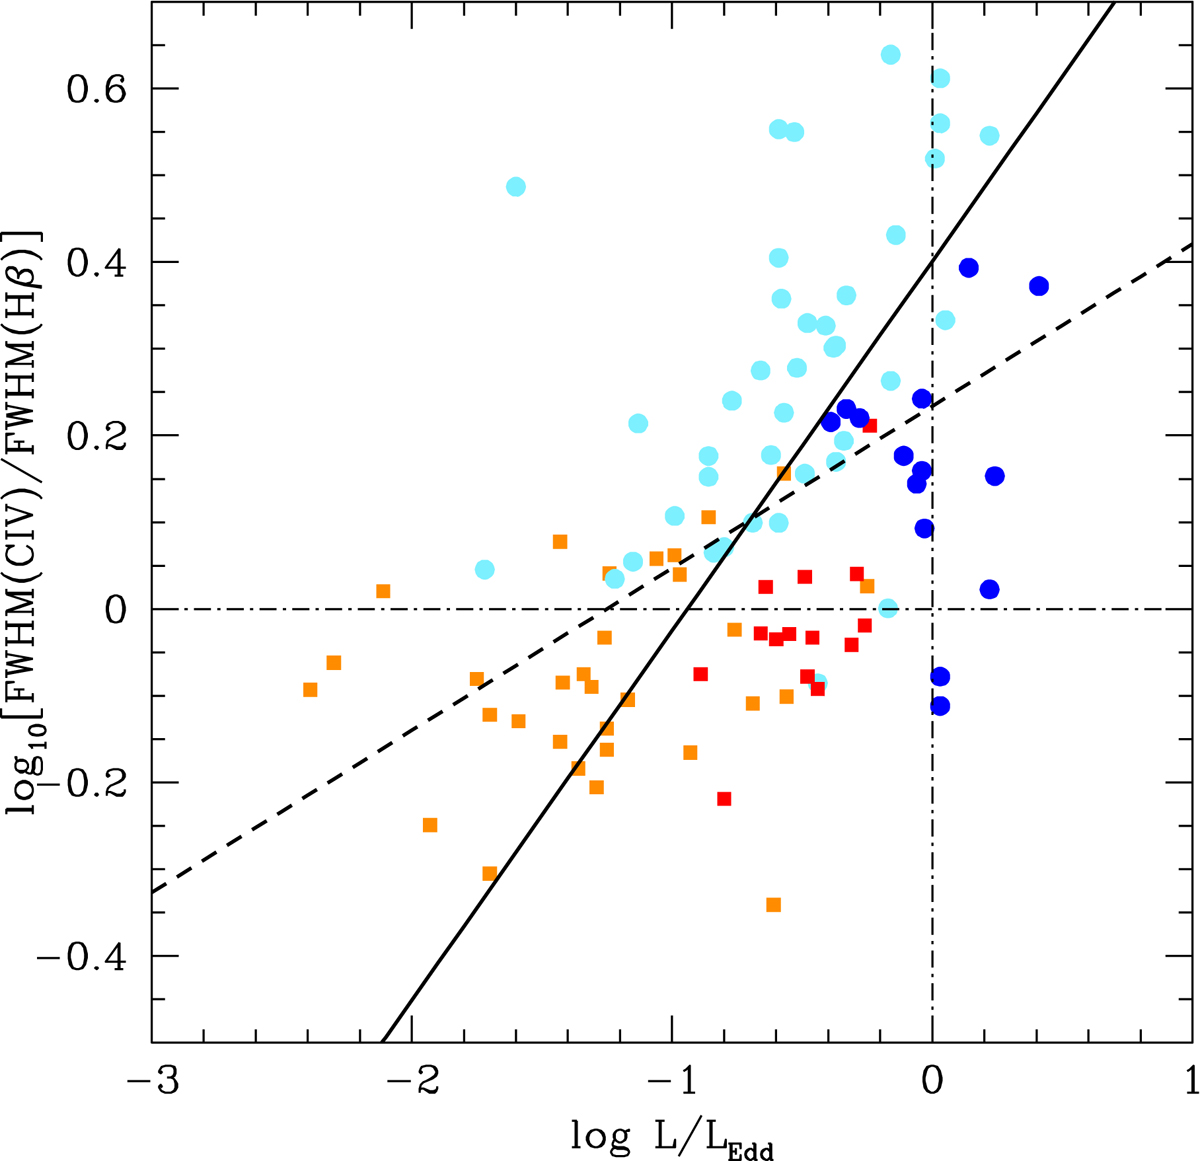
Relation between the logarithm of the FWHM ratio of C IVλ1549 to Hβ and the logarithm of the Eddington ratio L/LEdd. The vertical dot-dashed line traces the Eddington limit. The colors and shapes of symbols are as in Fig. 3. The dashed line is an unweighted least-squares fit, and the filled line was obtained with the bisector method (Feigelson & Babu 1992).
Current usage metrics show cumulative count of Article Views (full-text article views including HTML views, PDF and ePub downloads, according to the available data) and Abstracts Views on Vision4Press platform.
Data correspond to usage on the plateform after 2015. The current usage metrics is available 48-96 hours after online publication and is updated daily on week days.
Initial download of the metrics may take a while.