Fig. 3.
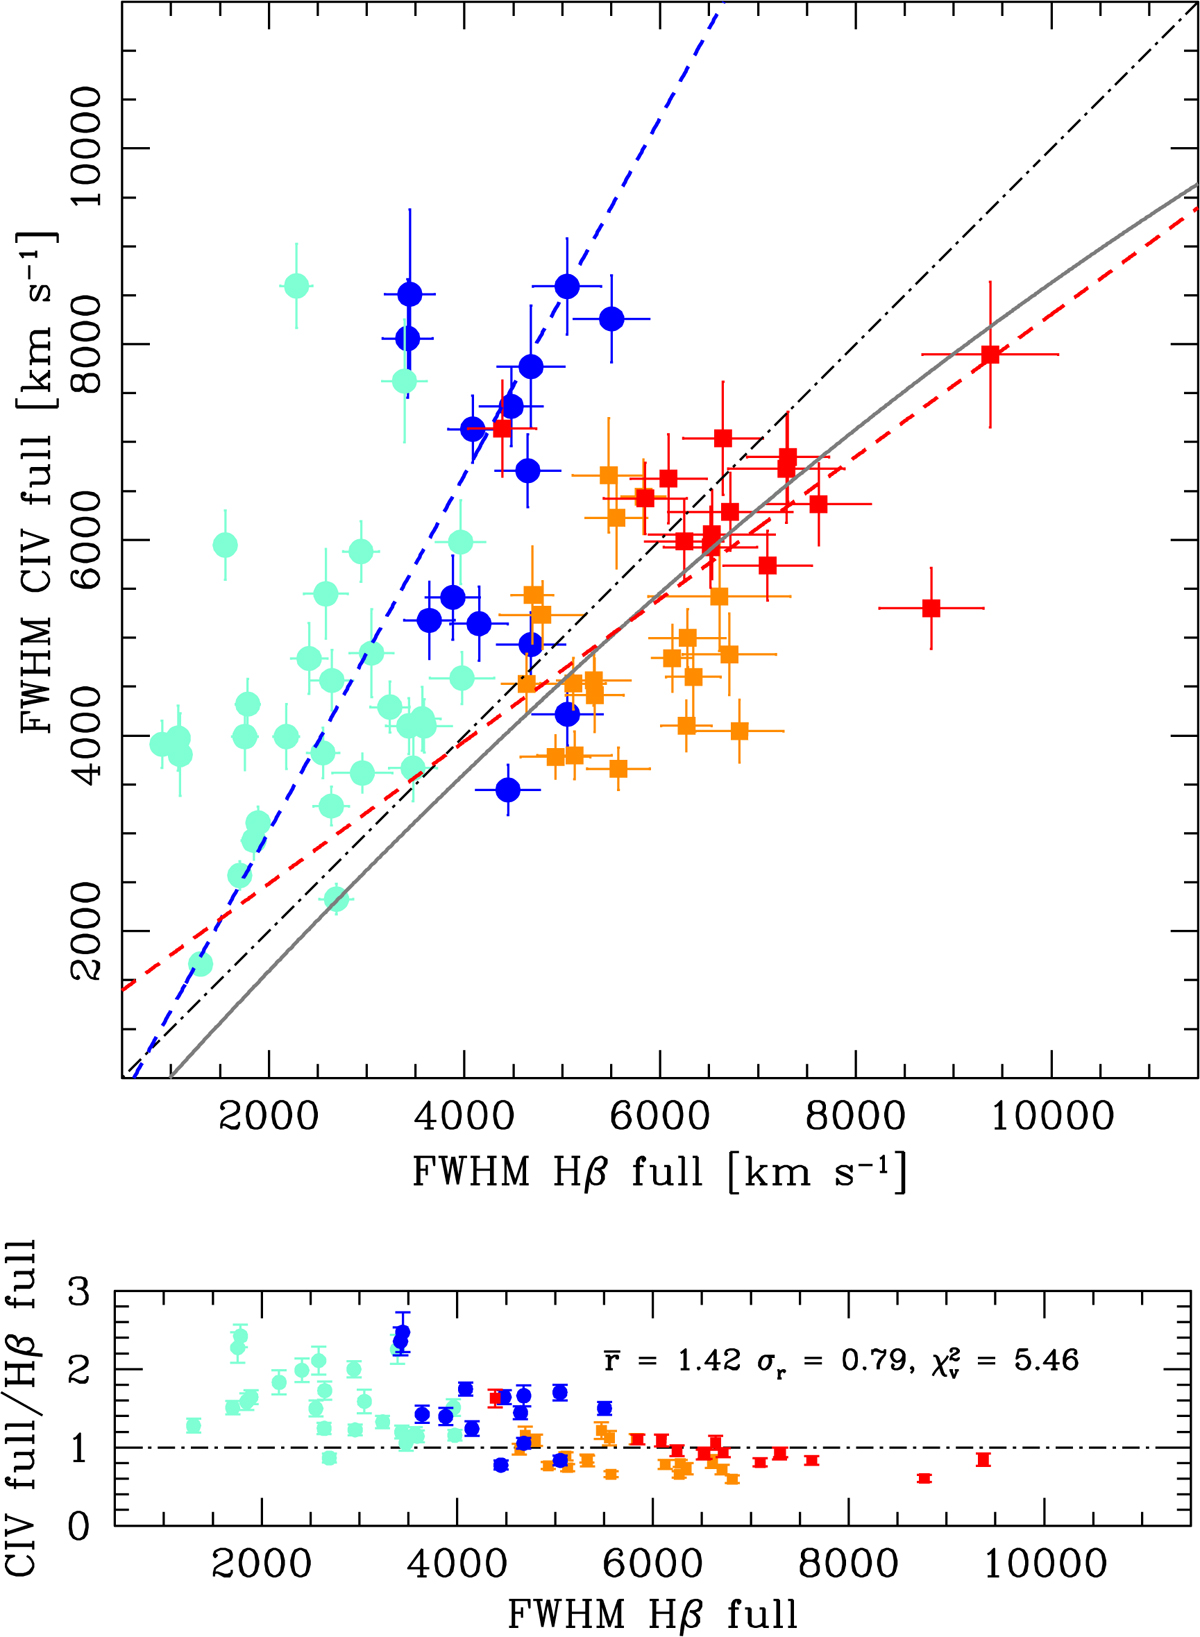
Top panel: FWHM(C IVλ1549) vs. FWHM(Hβ) (full profiles) for the FOS+HE sample. Data points are color-coded according to sample and population: HE Pop. A – blue circles (![]() ), HE Pop. B – red squares (
), HE Pop. B – red squares (![]() ), FOS Pop. A – aquamarine circles (
), FOS Pop. A – aquamarine circles (![]() ), and FOS Pop. B – golden squares (
), and FOS Pop. B – golden squares (![]() ). Best fitting least-square lines (dashed) are shown in blue for all Pop. A and red for all Pop. B. The black dot-dashed line is the equality line. The continuous gray line is the expected FWHM following the correction of Sulentic et al. (2006a, corr). Lower panel: ratio between FWHM C IVλ1549 and FWHM Hβ as a function of FWHM (Hβ).
). Best fitting least-square lines (dashed) are shown in blue for all Pop. A and red for all Pop. B. The black dot-dashed line is the equality line. The continuous gray line is the expected FWHM following the correction of Sulentic et al. (2006a, corr). Lower panel: ratio between FWHM C IVλ1549 and FWHM Hβ as a function of FWHM (Hβ).
Current usage metrics show cumulative count of Article Views (full-text article views including HTML views, PDF and ePub downloads, according to the available data) and Abstracts Views on Vision4Press platform.
Data correspond to usage on the plateform after 2015. The current usage metrics is available 48-96 hours after online publication and is updated daily on week days.
Initial download of the metrics may take a while.