Fig. C.1.
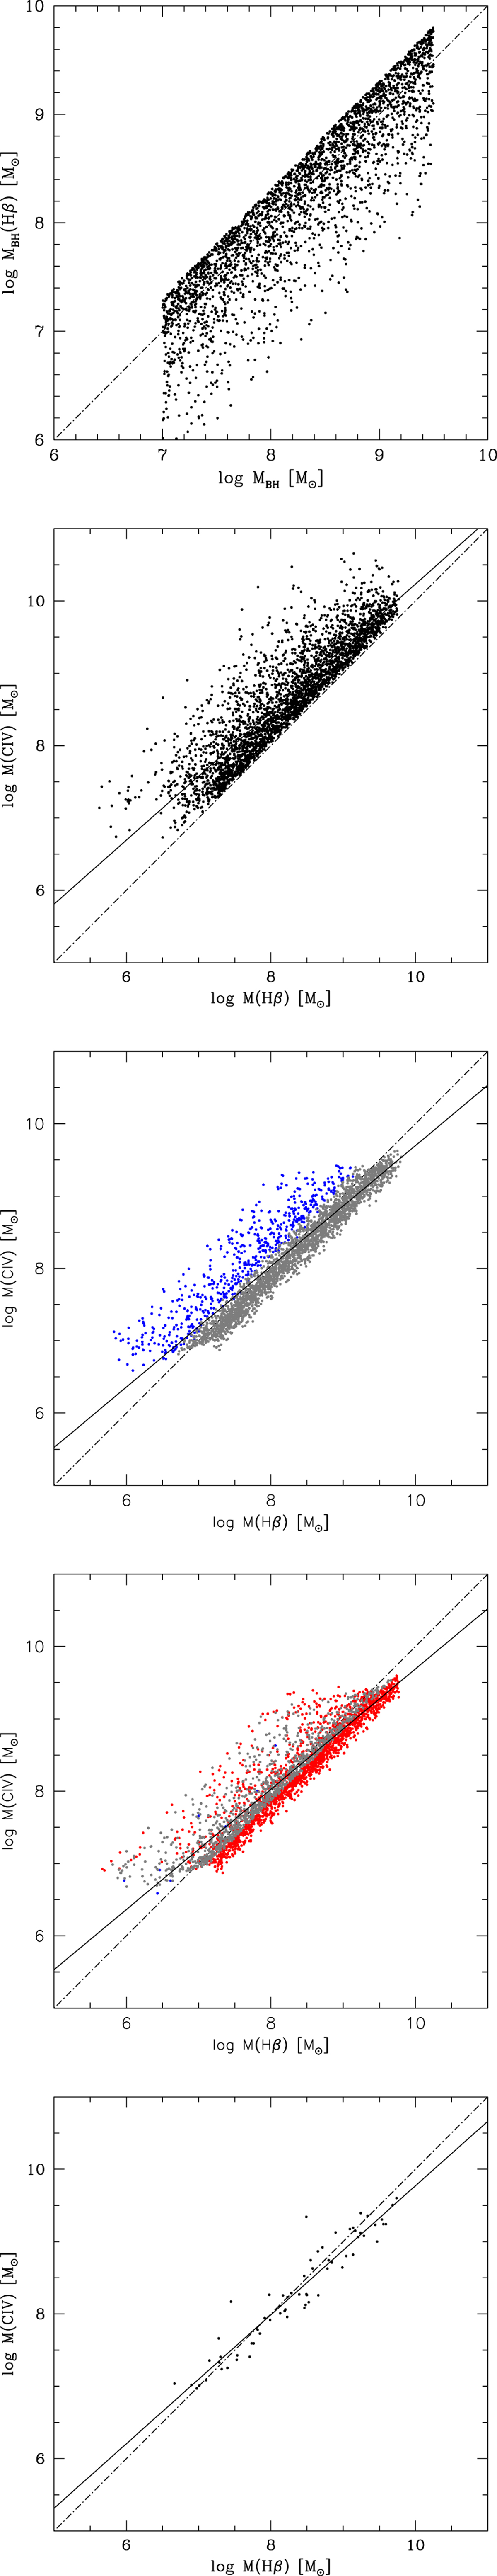
Top: MBH with effect of orientation via Eq. (10) vs. the “true” MBH, for a synthetic sample of 10 000 sources. Second from top: MBH C IVλ1549 vs. MBH Hβ estimated for an Eddington ratio distribution as described in the text and no correction. Third from top: FWHM MBH C IVλ1549 corrected because of outflow broadening using a correction factor ξ. The blue dots identify the MBH Hβ estimates that are under 0.33 dex the true MBH; the red ones are for overestimates by more than 0.33 dex. The gray dots represent mass estimates within −0.33 and +0.33 dex from the true value. Fourth from top: as above but with color-coding referring to C IVλ1549 MBH. Bottom: synthetic sample with n ≲ 80 sources, as in the FOS+HE sample. See text for more details. In all panels, the dot-dashed line is the equality line; the filled line traces an unweighted least-squares fit.
Current usage metrics show cumulative count of Article Views (full-text article views including HTML views, PDF and ePub downloads, according to the available data) and Abstracts Views on Vision4Press platform.
Data correspond to usage on the plateform after 2015. The current usage metrics is available 48-96 hours after online publication and is updated daily on week days.
Initial download of the metrics may take a while.