Fig. 10.
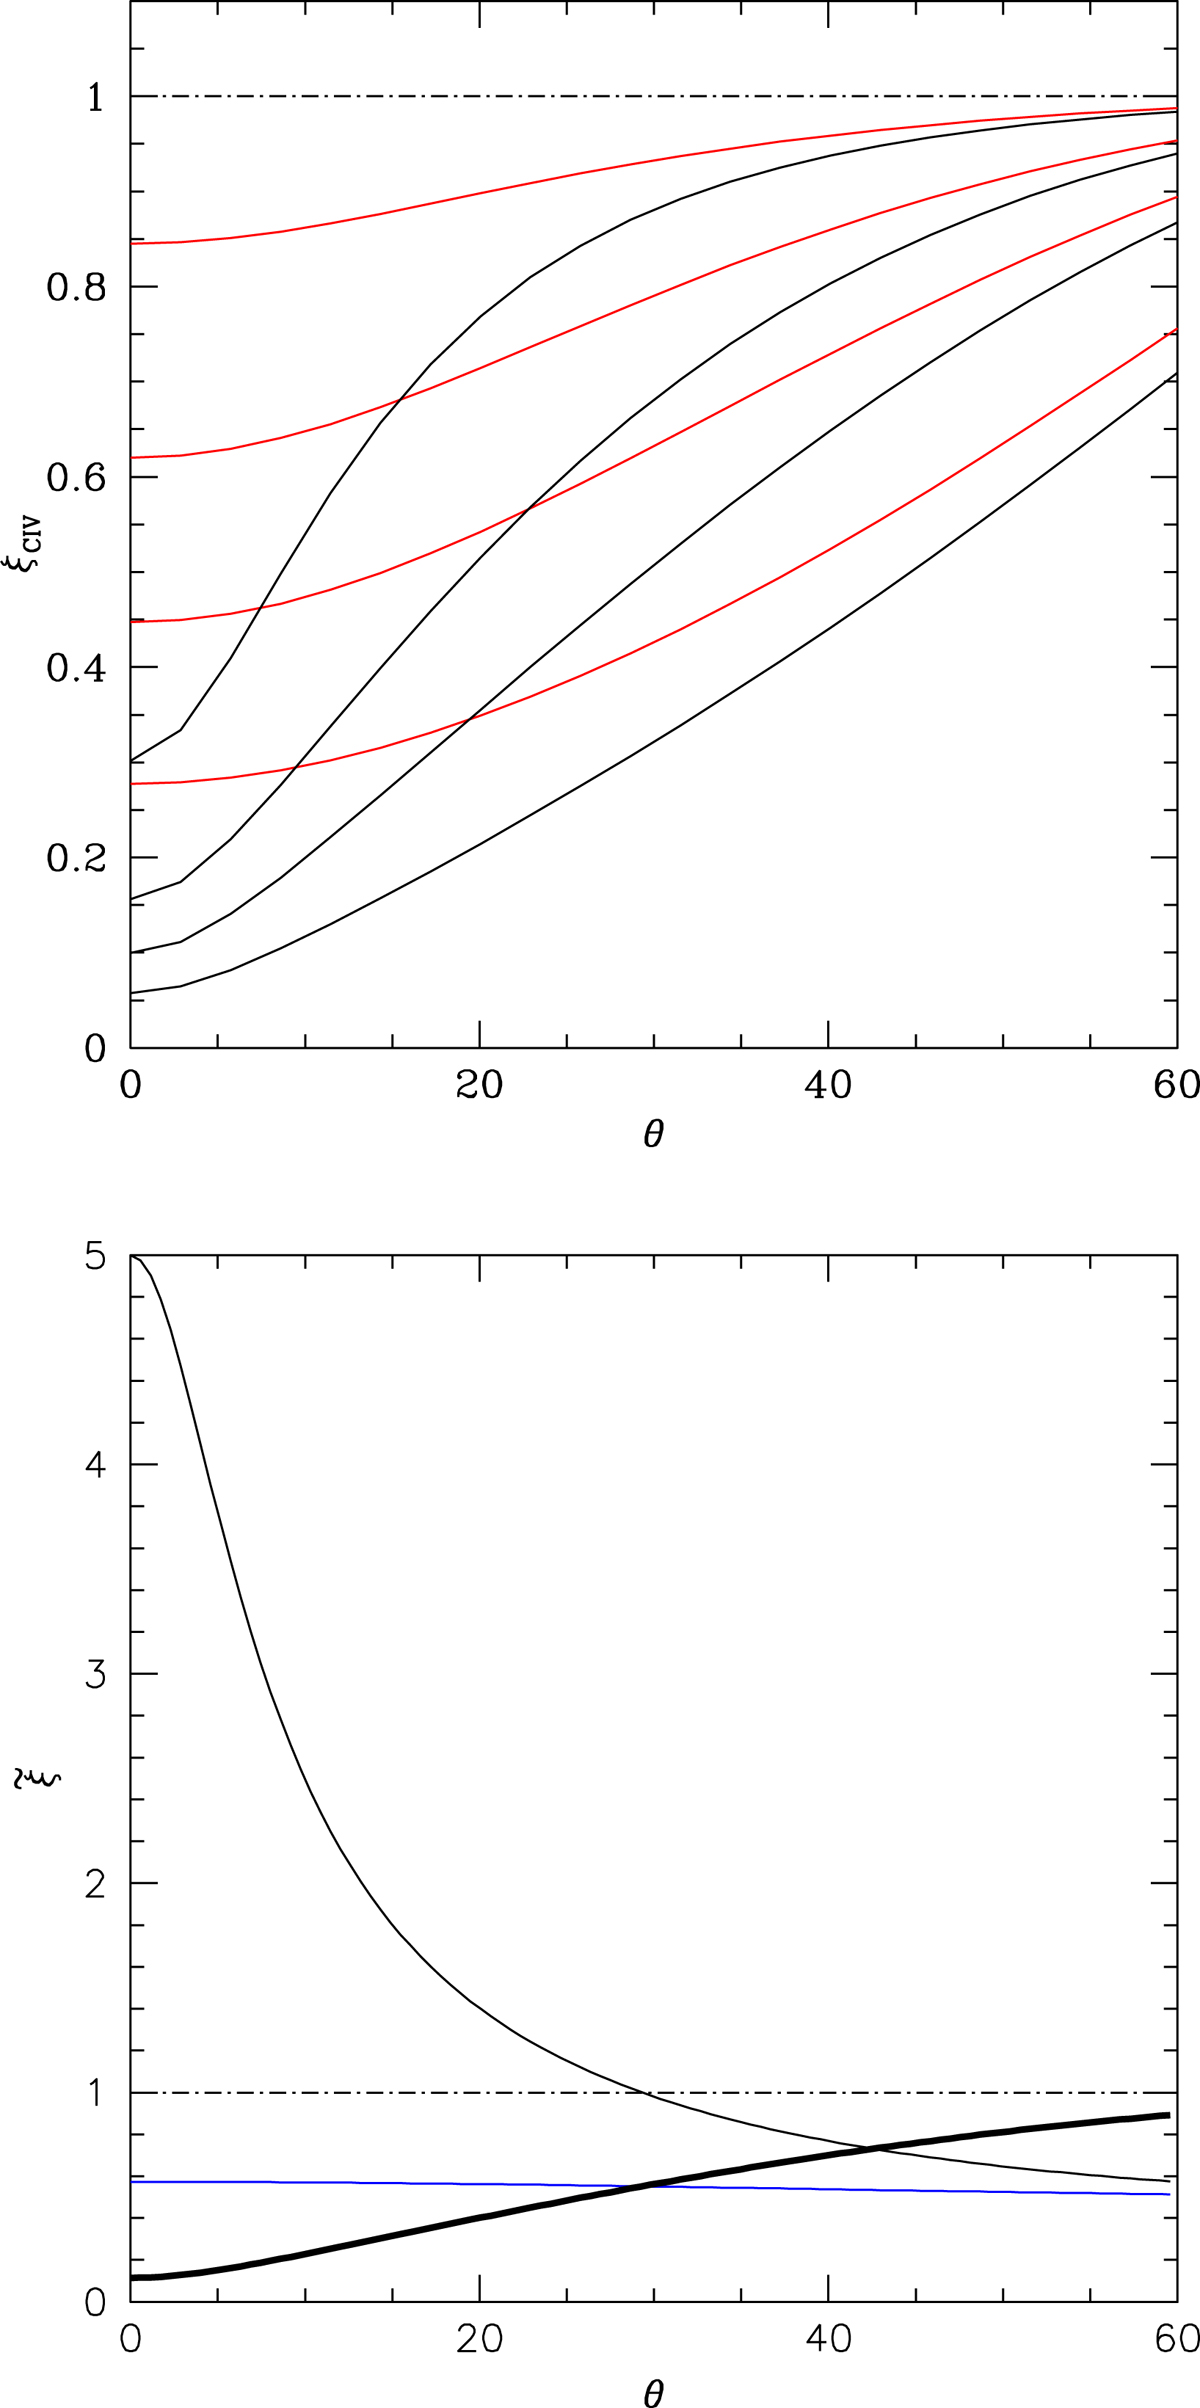
Top panel: parameter ξCIV behavior as a function of viewing angle as a function of θ for a “thin” emitting region with κ = 0.1, for different 𝒬 values (0.4, 1.6, 4.0, 12.0; black lines). Red line: ξCIV behavior for a thick emitting region κ = 0.5, for the same 𝒬 values. Bottom panel: as in top panel but for κ = 0.1, with 𝒬 = 12. The thin lines are the ![]() values for Hβ (black) and C IVλ1549 (blue). See text for more details. The thick line is their ratio (also shown in the top panel).
values for Hβ (black) and C IVλ1549 (blue). See text for more details. The thick line is their ratio (also shown in the top panel).
Current usage metrics show cumulative count of Article Views (full-text article views including HTML views, PDF and ePub downloads, according to the available data) and Abstracts Views on Vision4Press platform.
Data correspond to usage on the plateform after 2015. The current usage metrics is available 48-96 hours after online publication and is updated daily on week days.
Initial download of the metrics may take a while.