Fig. 6.
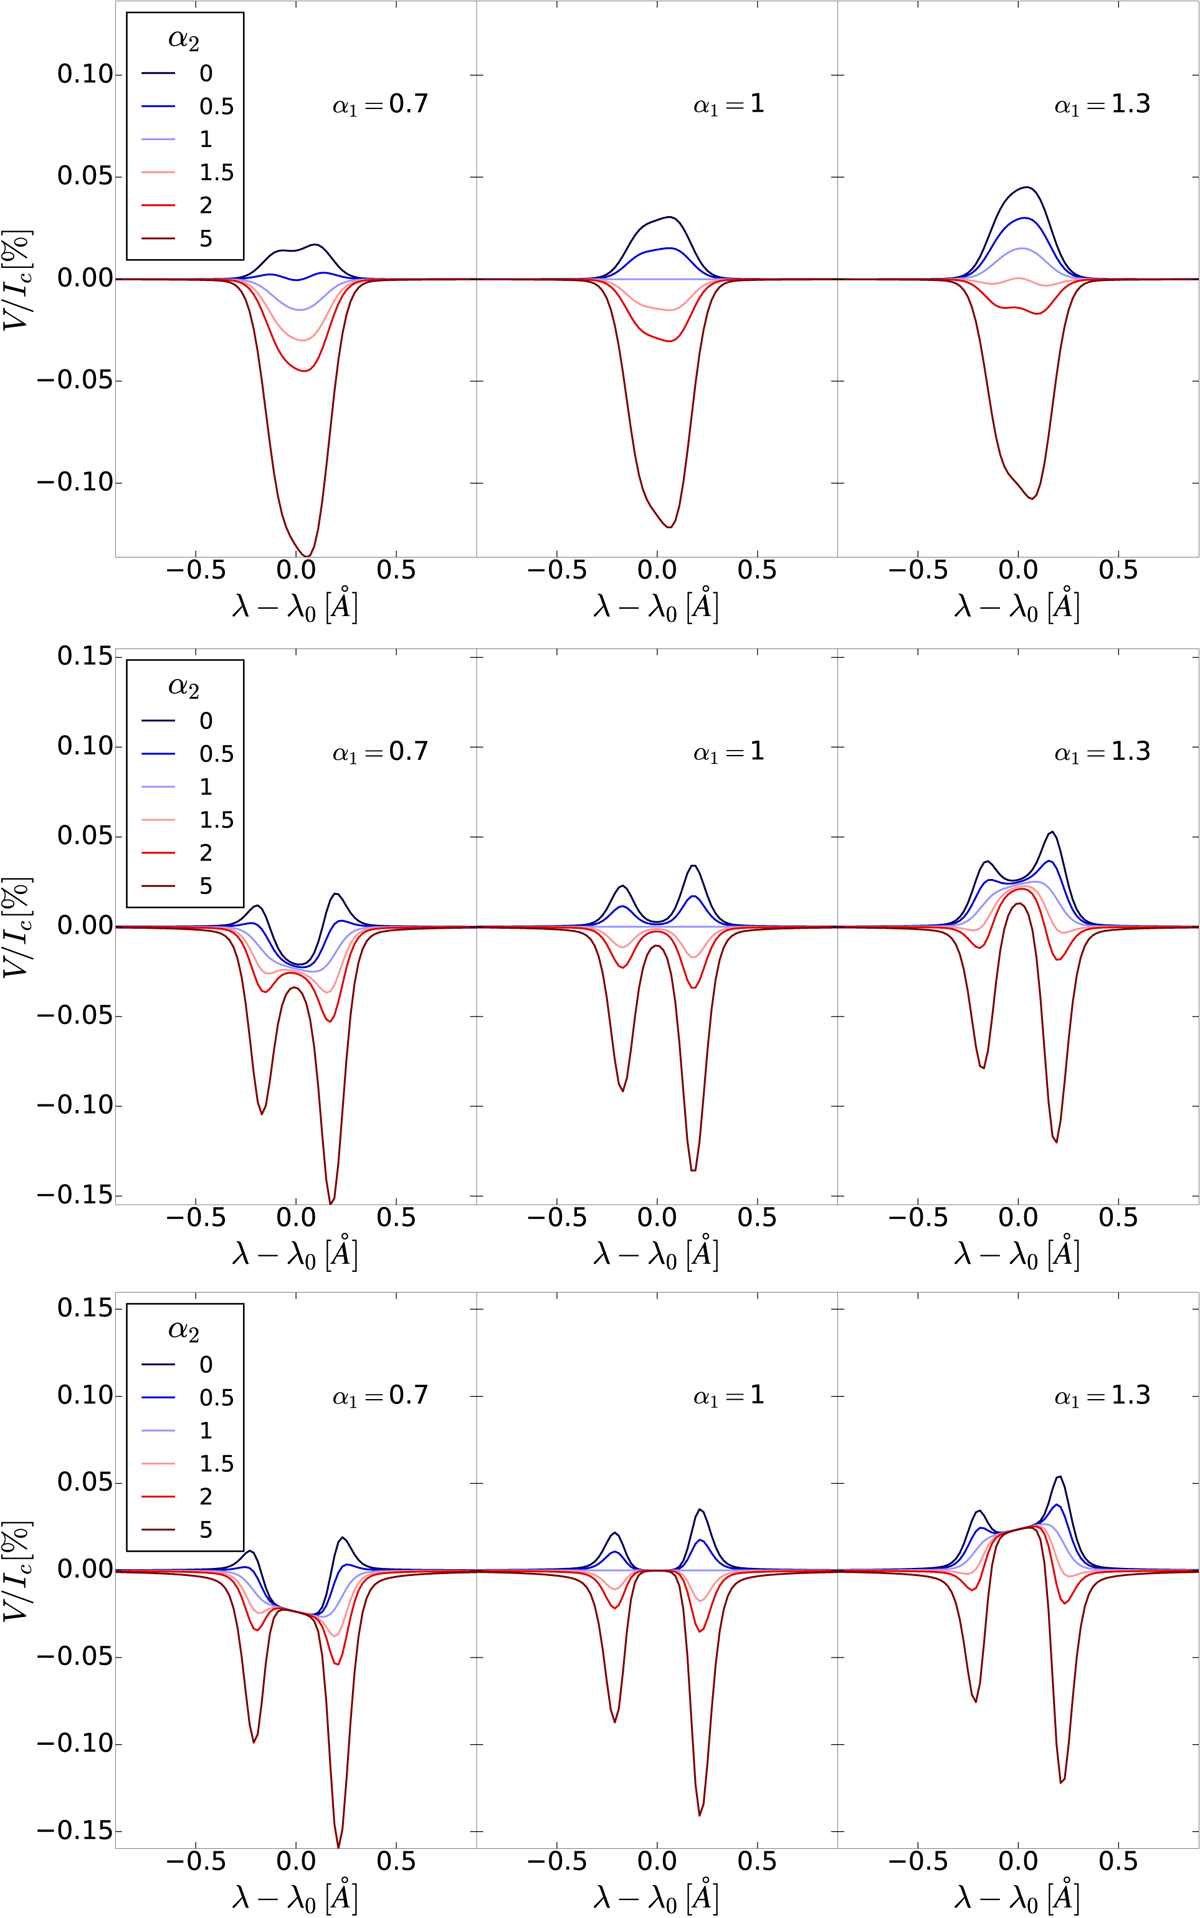
Stokes V normalized to the continuum intensity in the Na ID1 line for B = 0, constant w1, and for different constant boundary illuminations (α2 = I0/S) and positive values of α1 = SV/S. Top (Tν0 = 1): opacity is not enough to create the peaks. Middle (Tν0 = 5): peaks are clearly formed. Bottom: (Tν0 = 10): peaks are fully contrasted and start to saturate. The level of the central dip depends on the Stokes V emissivity.
Current usage metrics show cumulative count of Article Views (full-text article views including HTML views, PDF and ePub downloads, according to the available data) and Abstracts Views on Vision4Press platform.
Data correspond to usage on the plateform after 2015. The current usage metrics is available 48-96 hours after online publication and is updated daily on week days.
Initial download of the metrics may take a while.