Fig. 3.
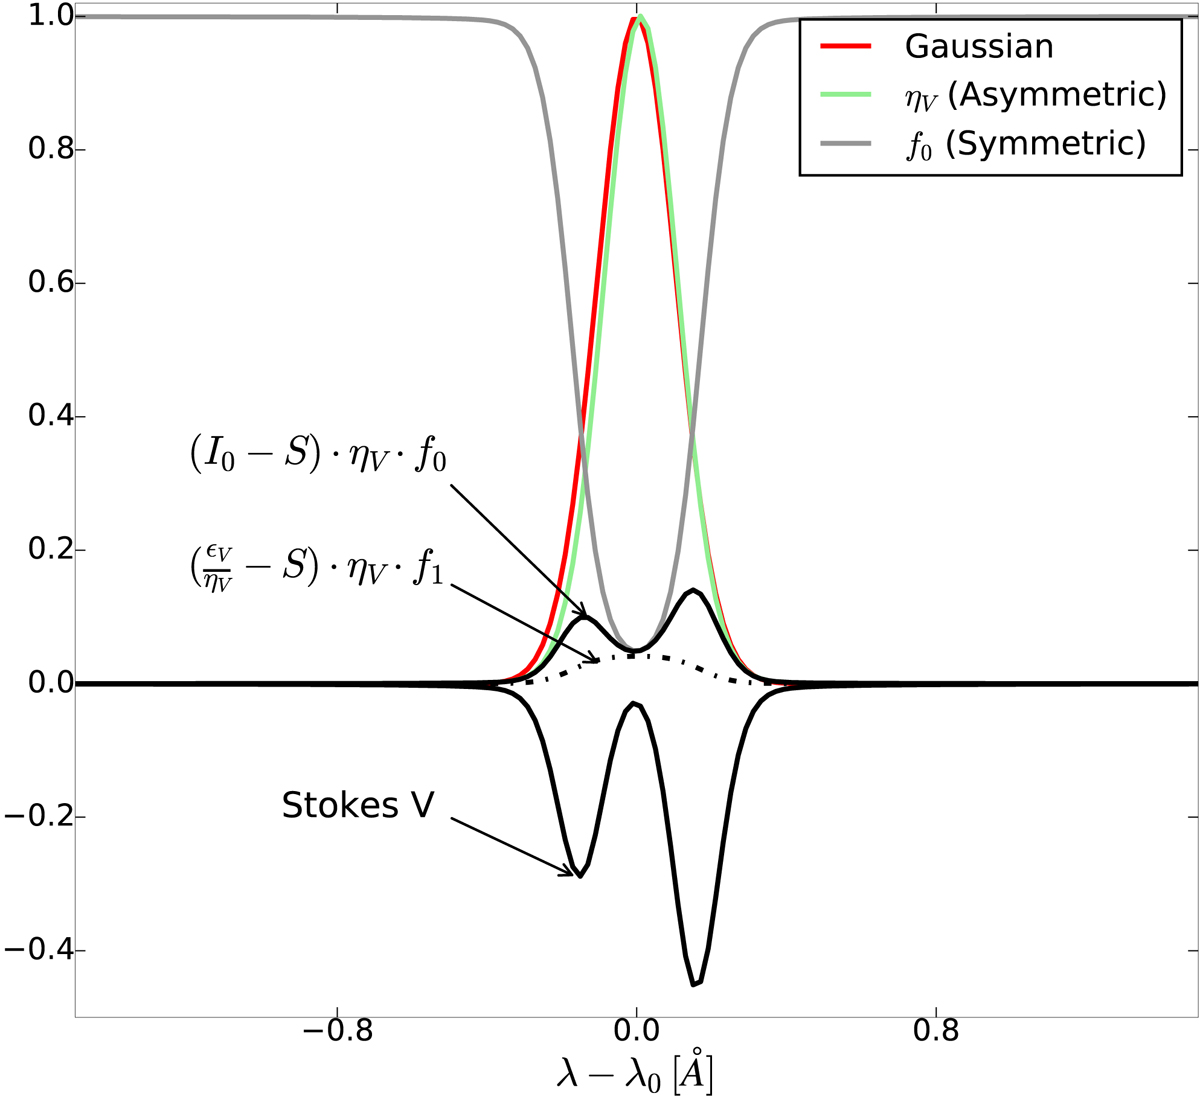
Generation of an asymmetric double-peak profile with B = 0 and atomic orientation (w1 = 5%) following Eq. (9). The quantities represented in the vertical axis are labeled inside the figure but only their shapes are important here. The green curve is normalized to one, and the black curves are multiplied by the same constant, in order to plot everything together. The factors ϵV and ηV were calculated for the Na I D2 line in a multilevel atom with HFS.
Current usage metrics show cumulative count of Article Views (full-text article views including HTML views, PDF and ePub downloads, according to the available data) and Abstracts Views on Vision4Press platform.
Data correspond to usage on the plateform after 2015. The current usage metrics is available 48-96 hours after online publication and is updated daily on week days.
Initial download of the metrics may take a while.