Fig. 16.
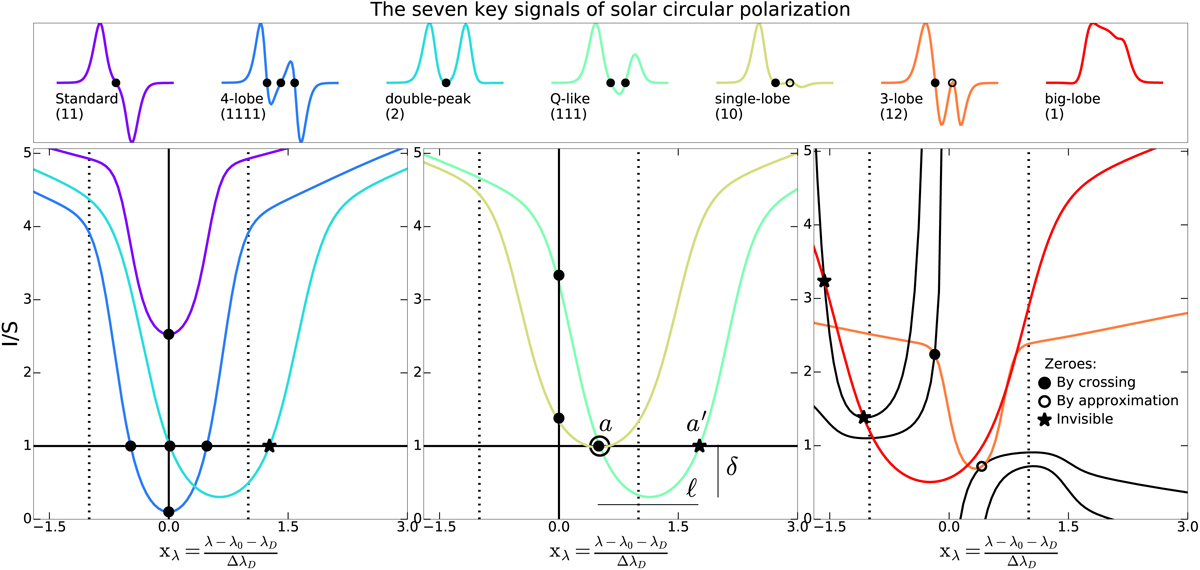
Representative solar Stokes V signals (upper panel) explained by associating their zeros (see legend) with intersections between background (colors) and critical (black) intensities. Vertical dotted lines limit the relevant absorption region (|xλ| < 1). The medium is weakly magnetized (β = 0.05), and optically thick (Tν0 = 3) for all cases, but Tν0 = 1.5 for the three-lobe profile. The values of continuum-to-line opacity (rc = 0.01) and atomic orientation (![]() in the right panel or
in the right panel or ![]() in the other ones) were chosen to ease the explanations.
in the other ones) were chosen to ease the explanations.
Current usage metrics show cumulative count of Article Views (full-text article views including HTML views, PDF and ePub downloads, according to the available data) and Abstracts Views on Vision4Press platform.
Data correspond to usage on the plateform after 2015. The current usage metrics is available 48-96 hours after online publication and is updated daily on week days.
Initial download of the metrics may take a while.