Fig. 15.
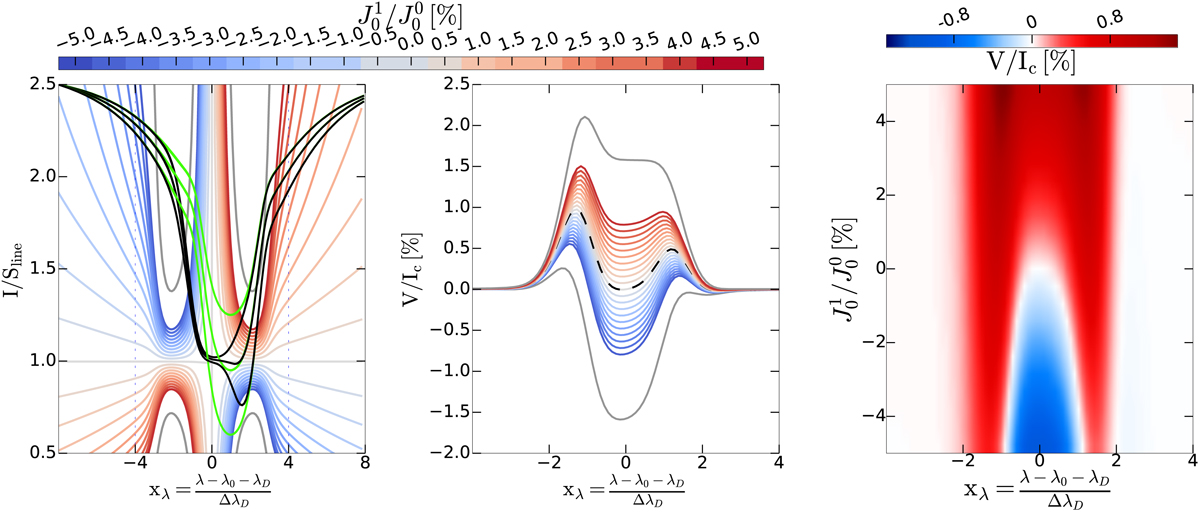
Examples of critical intensity in Na I D1. Left panel: three background intensities (green lines) and their corresponding emergent intensities (black lines) on top of the critical intensity spectra computed for different values of atomic orientation (see discrete color bar) and normalized to Sline = min(S). The gray lines are references corresponding to ![]() . Middle panel: Stokes V signals corresponding to the deepest intensity profile. The case
. Middle panel: Stokes V signals corresponding to the deepest intensity profile. The case ![]() is made more visible by the dashed black line. Right panel: same signals as in middle panel but plotted in 2D.
is made more visible by the dashed black line. Right panel: same signals as in middle panel but plotted in 2D.
Current usage metrics show cumulative count of Article Views (full-text article views including HTML views, PDF and ePub downloads, according to the available data) and Abstracts Views on Vision4Press platform.
Data correspond to usage on the plateform after 2015. The current usage metrics is available 48-96 hours after online publication and is updated daily on week days.
Initial download of the metrics may take a while.