Fig. 12.
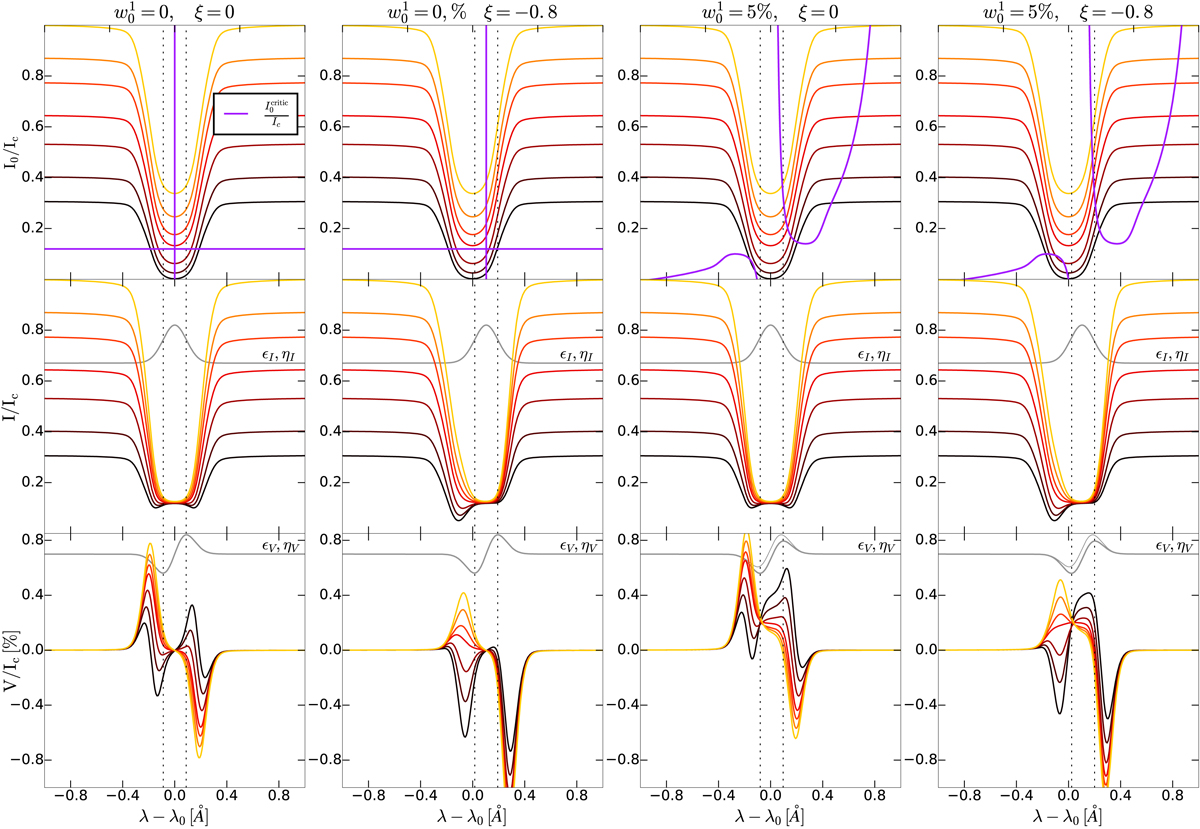
Formation of NLTE circular polarization with atomic polarization and velocity gradients in the Na I D1 line. The figure indirectly explains why the double-peak and Q-like V signals of the solar Na I D lines are more often found near the solar limb (black profiles) than at the disk center (yellow). The calculation is done with μ = 0.1, Tν0 = 4, α = 3.14 (with T = 6.5 kK and microturbulent velocity υmicro = 6.5 km s−1), Ic = 2 × 10⁻⁵ (cgs units), β = 0.01 (B = 154 G with B parallel to LOS vector). Violet lines: critical intensity ![]() .
.
Current usage metrics show cumulative count of Article Views (full-text article views including HTML views, PDF and ePub downloads, according to the available data) and Abstracts Views on Vision4Press platform.
Data correspond to usage on the plateform after 2015. The current usage metrics is available 48-96 hours after online publication and is updated daily on week days.
Initial download of the metrics may take a while.