Fig. 1.
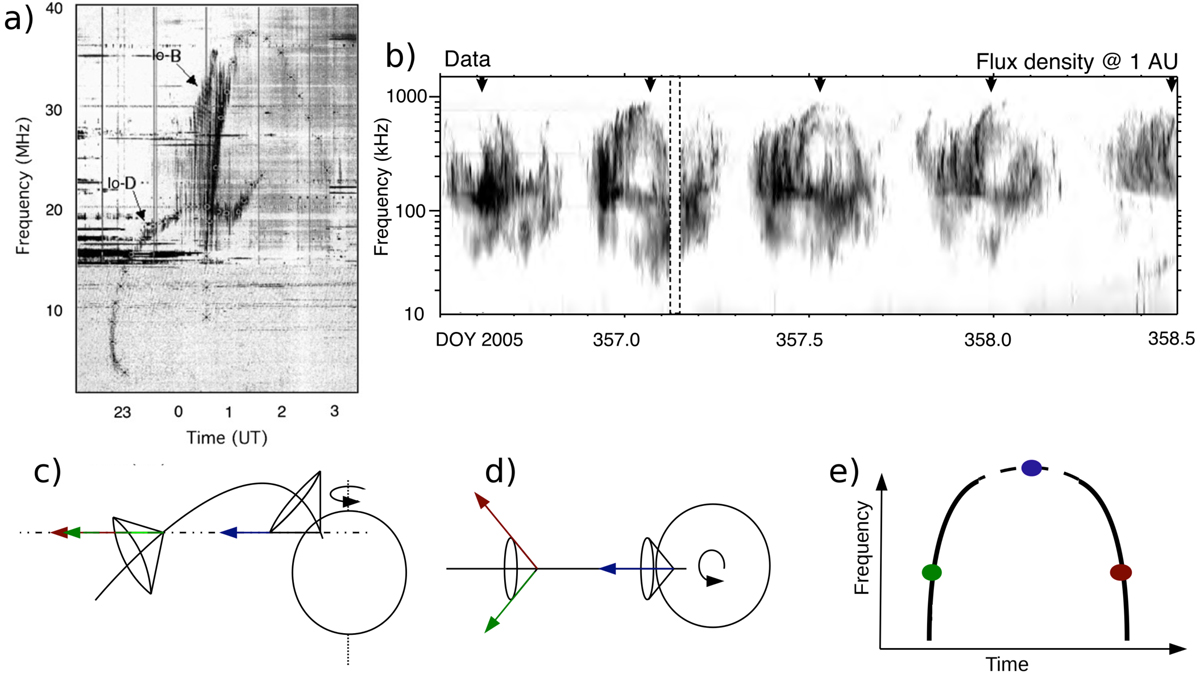
Panels a and b: examples of time-frequency radio arcs. Panel a: radio arcs emitted by the Io-Jupiter interaction (Queinnec & Zarka 1998), observed by Wind (0–15 MHz) and the Nançay Decameter Array (15–40 MHz). Panel b: radio arcs at Saturn, observed by Cassini, related to a sub-corotating hot spot in the magnetosphere of Saturn (Lamy et al. 2008). Panels c and d: side and polar views of the emission geometry, with two sources located along the same magnetic field line but at different altitudes. Arrows show the direction of propagation of the radio waves which can be seen by an observer located in the equatorial plane far from the planet. Panels e: dynamic spectrum of the emissions which would correspond to the geometry of panels c and d.
Current usage metrics show cumulative count of Article Views (full-text article views including HTML views, PDF and ePub downloads, according to the available data) and Abstracts Views on Vision4Press platform.
Data correspond to usage on the plateform after 2015. The current usage metrics is available 48-96 hours after online publication and is updated daily on week days.
Initial download of the metrics may take a while.