Fig. 5.
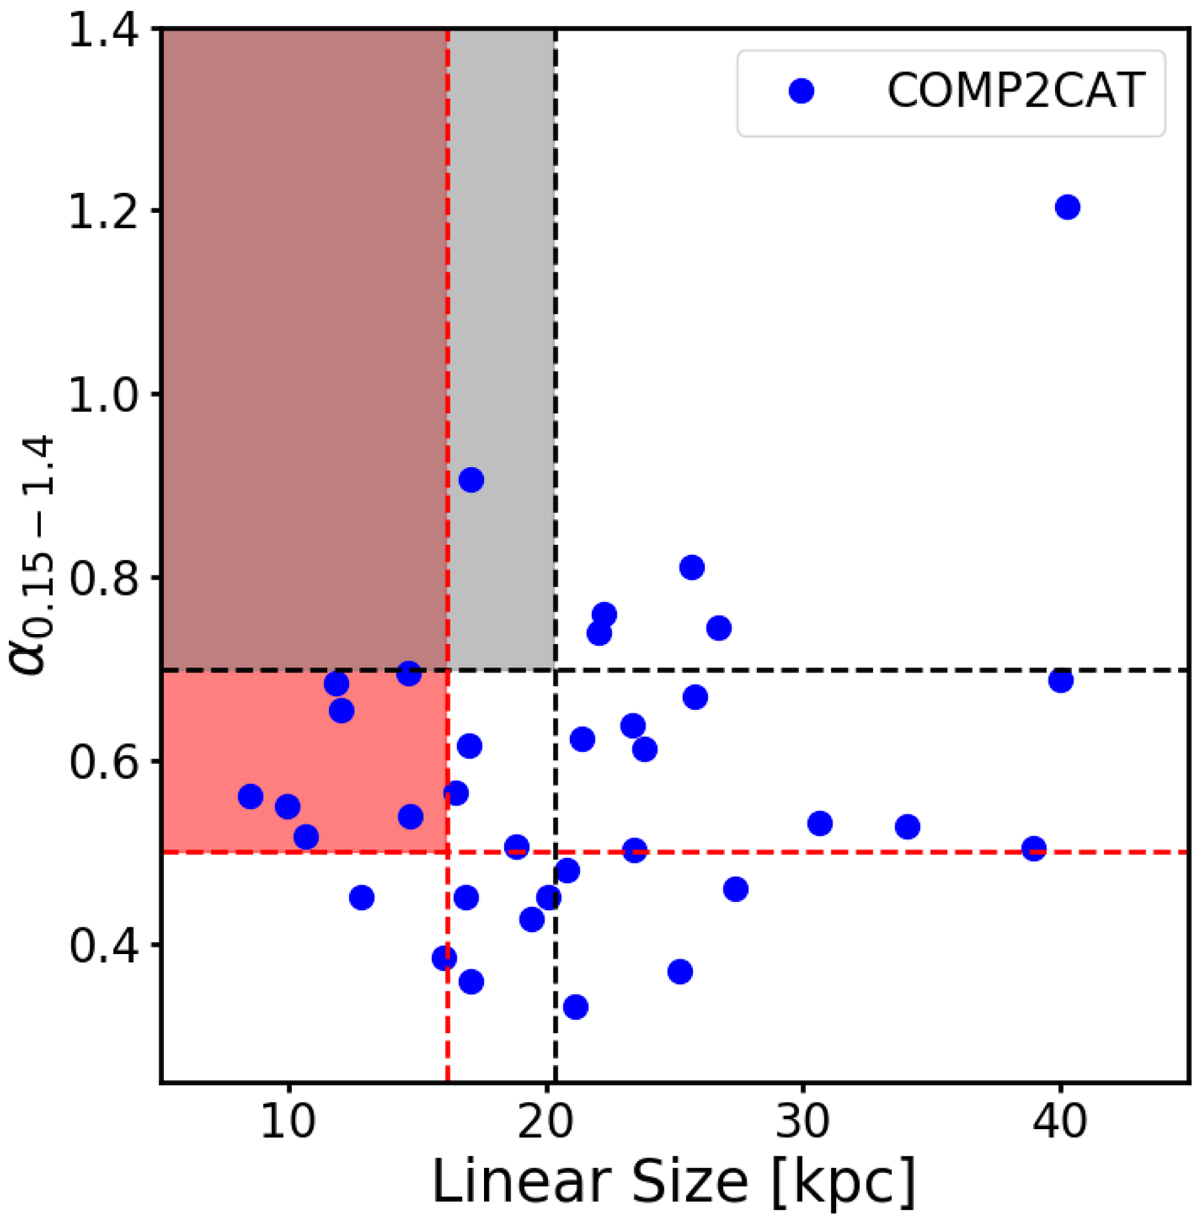
Spectral index between 150 MHz and 1.4 GHz vs. linear size of COMP2CAT sources. The red lines mark the criteria chosen by Labiano (2006) to define CSSs: projected linear sizes below 15 kpc and α0.15 − 1.4 ≳ 0.5 (corrected using the cosmology adopted). The area shaded in red corresponds to sources that would be considered CSSs according to these criteria. The black lines correspond to the criteria presented by Orienti & Dallacasa (2014): projected linear sizes smaller than 20 kpc and α0.15 − 1.4 ≳ 0.7 (also corrected using our cosmology). The area shaded in gray marks the CSS area in the diagram based on the Orienti & Dallacasa (2014) selection.
Current usage metrics show cumulative count of Article Views (full-text article views including HTML views, PDF and ePub downloads, according to the available data) and Abstracts Views on Vision4Press platform.
Data correspond to usage on the plateform after 2015. The current usage metrics is available 48-96 hours after online publication and is updated daily on week days.
Initial download of the metrics may take a while.